

Question: please answer b-h Csaptos and Rates of Return INTEGRATE CASE ILL FINCH INC. RISK AND RETURN Assume that you recently graduated with a major in
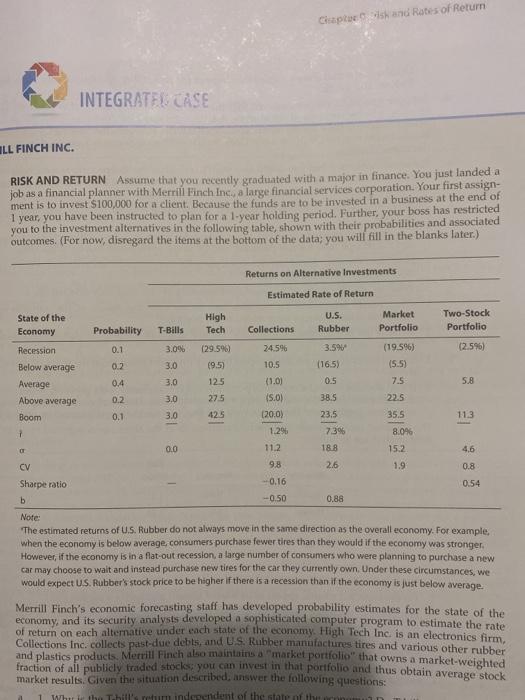
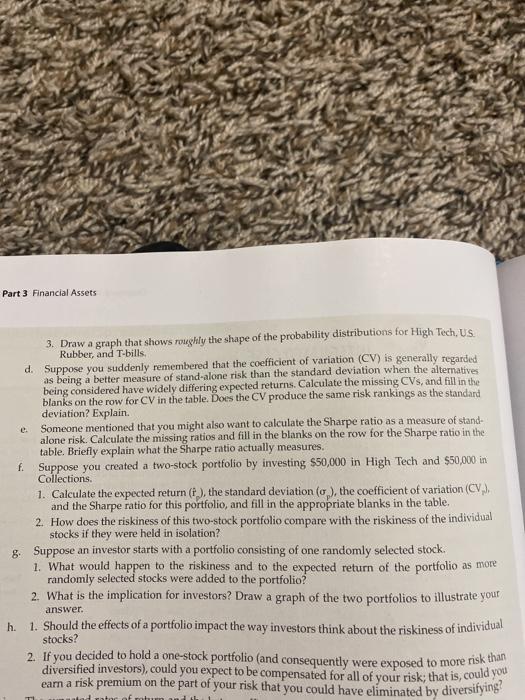
Csaptos and Rates of Return INTEGRATE CASE ILL FINCH INC. RISK AND RETURN Assume that you recently graduated with a major in finance. You just landed a job as a financial planner with Merril Finch Inc., a large financial services corporation. Your first assign- ment is to invest $100,000 for a client. Because the funds are to be invested in a business at the end of 1 year, you have been instructed to plan for a 1-year holding period. Further, your boss has restricted you to the investment alternatives in the following table, shown with their probabilities and associated outcomes. (For now, disregard the items at the bottom of the data; you will fill in the blanks later.) Returns on Alternative Investments U.S. Rubber 3.0 125 7.5 5.8 0.2 3.0 22.5 0.1 425 11.2 26 1.9 0.8 -0.16 0.54 Estimated Rate of Return State of the High Two-Stock Market Economy Probability T-Bills Tech Collections Portfolio Portfolio Recession 0.1 3.0% (29.5%) 24.596 3.59 (19.5%) (2.5%) Below average 0.2 (9.5) 10.5 (16.5) (5.5) 0.4 3.0 (1.0) Average 0.5 Above average 27.5 (5.0) 38.5 Boom 3.0 120.0) 23.5 35,5 113 1 1.296 7.3% 8.046 0.0 188 15.2 CV 9.8 Sharpe ratio b -0.50 Note: The estimated returns of U.S. Rubber do not always move in the same direction as the overall economy. For example, when the economy is below average consumers purchase fewer tires than they would if the economy was stronger. However, if the economy is in a flat-out recession, a large number of consumers who were planning to purchase a new car may choose to wait and instead purchase new tires for the car they currently own. Under these circumstances, we would expect U.S. Rubber's stock price to be higher if there is a recession than if the economy is just below average. Merrill Finch's economic forecasting staff has developed probability estimates for the state of the economy, and its security analysts developed a sophisticated computer program to estimate the rate Collections Inc. collects past-due debts, and us Rubber manufactures tires and various other rubber fraction of all publicly traded stock you can invest in that portfolio and thus obtain average stock market results. Given the situation described, answer the following questions: Where the T hill's retum independent of the state of the 0.88 omy b. Calculate the expected rate of return on each alternative, and fill in the blanks on the row for rin the previous table. C. You should recognize that basing a decision solely on expected returns is appropriate only for risk-neutral individuals. Because your client, like most people, is risk-averse, the riskiness of each alternative is an important aspect of the decision. One possible measure of risk is the standard deviation of returns 1. Calculate this value for each alternative and fill in the blank on the row for or in the table. 2. What type of risk is measured by the standard deviation? Part 3 Financial Assets 3. Draw a graph that shows roughly the shape of the probability distributions for High Tech US. Rubber, and T-bills d. Suppose you suddenly remembered that the coefficient of variation (CV) is generally regarded as being a better measure of stand-alone risk than the standard deviation when the alternatives being considered have widely differing expected returns. Calculate the missing CVs, and fill in the blanks on the row for CV in the table. Does the CV produce the same risk rankings as the standard deviation? Explain Someone mentioned that you might also want to calculate the Sharpe ratio as a measure of stand- alone risk. Calculate the missing ratios and fill in the blanks on the row for the Sharpe ratio in the table. Briefly explain what the Sharpe ratio actually measures. f Suppose you created a two-stock portfolio by investing $50,000 in High Tech and $50,000 in Collections. 1. Calculate the expected return (f), the standard deviation (o,), the coefficient of variation (CV) and the Sharpe ratio for this portfolio, and fill in the appropriate blanks in the table. 2. How does the riskiness of this two-stock portfolio compare with the riskiness of the individual stocks if they were held in isolation? 8. Suppose an investor starts with a portfolio consisting of one randomly selected stock. 1. What would happen to the riskiness and to the expected return of the portfolio as more randomly selected stocks were added to the portfolio? 2. What is the implication for investors? Draw a graph of the two portfolios to illustrate your h. 1. Should the effects of a portfolio impact the way investors think about the riskiness of individual stocks? 2. If you decided to hold a one-stock portfolio (and consequently were exposed to more risk than diversified investors), could you expect to be compensated for all of your risk; that is, could you earn a risk premium on the part of your risk that you could have eliminated by diversifying? answer. Csaptos and Rates of Return INTEGRATE CASE ILL FINCH INC. RISK AND RETURN Assume that you recently graduated with a major in finance. You just landed a job as a financial planner with Merril Finch Inc., a large financial services corporation. Your first assign- ment is to invest $100,000 for a client. Because the funds are to be invested in a business at the end of 1 year, you have been instructed to plan for a 1-year holding period. Further, your boss has restricted you to the investment alternatives in the following table, shown with their probabilities and associated outcomes. (For now, disregard the items at the bottom of the data; you will fill in the blanks later.) Returns on Alternative Investments U.S. Rubber 3.0 125 7.5 5.8 0.2 3.0 22.5 0.1 425 11.2 26 1.9 0.8 -0.16 0.54 Estimated Rate of Return State of the High Two-Stock Market Economy Probability T-Bills Tech Collections Portfolio Portfolio Recession 0.1 3.0% (29.5%) 24.596 3.59 (19.5%) (2.5%) Below average 0.2 (9.5) 10.5 (16.5) (5.5) 0.4 3.0 (1.0) Average 0.5 Above average 27.5 (5.0) 38.5 Boom 3.0 120.0) 23.5 35,5 113 1 1.296 7.3% 8.046 0.0 188 15.2 CV 9.8 Sharpe ratio b -0.50 Note: The estimated returns of U.S. Rubber do not always move in the same direction as the overall economy. For example, when the economy is below average consumers purchase fewer tires than they would if the economy was stronger. However, if the economy is in a flat-out recession, a large number of consumers who were planning to purchase a new car may choose to wait and instead purchase new tires for the car they currently own. Under these circumstances, we would expect U.S. Rubber's stock price to be higher if there is a recession than if the economy is just below average. Merrill Finch's economic forecasting staff has developed probability estimates for the state of the economy, and its security analysts developed a sophisticated computer program to estimate the rate Collections Inc. collects past-due debts, and us Rubber manufactures tires and various other rubber fraction of all publicly traded stock you can invest in that portfolio and thus obtain average stock market results. Given the situation described, answer the following questions: Where the T hill's retum independent of the state of the 0.88 omy b. Calculate the expected rate of return on each alternative, and fill in the blanks on the row for rin the previous table. C. You should recognize that basing a decision solely on expected returns is appropriate only for risk-neutral individuals. Because your client, like most people, is risk-averse, the riskiness of each alternative is an important aspect of the decision. One possible measure of risk is the standard deviation of returns 1. Calculate this value for each alternative and fill in the blank on the row for or in the table. 2. What type of risk is measured by the standard deviation? Part 3 Financial Assets 3. Draw a graph that shows roughly the shape of the probability distributions for High Tech US. Rubber, and T-bills d. Suppose you suddenly remembered that the coefficient of variation (CV) is generally regarded as being a better measure of stand-alone risk than the standard deviation when the alternatives being considered have widely differing expected returns. Calculate the missing CVs, and fill in the blanks on the row for CV in the table. Does the CV produce the same risk rankings as the standard deviation? Explain Someone mentioned that you might also want to calculate the Sharpe ratio as a measure of stand- alone risk. Calculate the missing ratios and fill in the blanks on the row for the Sharpe ratio in the table. Briefly explain what the Sharpe ratio actually measures. f Suppose you created a two-stock portfolio by investing $50,000 in High Tech and $50,000 in Collections. 1. Calculate the expected return (f), the standard deviation (o,), the coefficient of variation (CV) and the Sharpe ratio for this portfolio, and fill in the appropriate blanks in the table. 2. How does the riskiness of this two-stock portfolio compare with the riskiness of the individual stocks if they were held in isolation? 8. Suppose an investor starts with a portfolio consisting of one randomly selected stock. 1. What would happen to the riskiness and to the expected return of the portfolio as more randomly selected stocks were added to the portfolio? 2. What is the implication for investors? Draw a graph of the two portfolios to illustrate your h. 1. Should the effects of a portfolio impact the way investors think about the riskiness of individual stocks? 2. If you decided to hold a one-stock portfolio (and consequently were exposed to more risk than diversified investors), could you expect to be compensated for all of your risk; that is, could you earn a risk premium on the part of your risk that you could have eliminated by diversifying
Step by Step Solution
There are 3 Steps involved in it

Get step-by-step solutions from verified subject matter experts