

Question: Please answer Blank 1 and 2 in question 5 and Blank 1 and 2 in question 8. Question 5 (0.2 points) Suppose that the causal
Please answer Blank 1 and 2 in question 5 and Blank 1 and 2 in question 8.
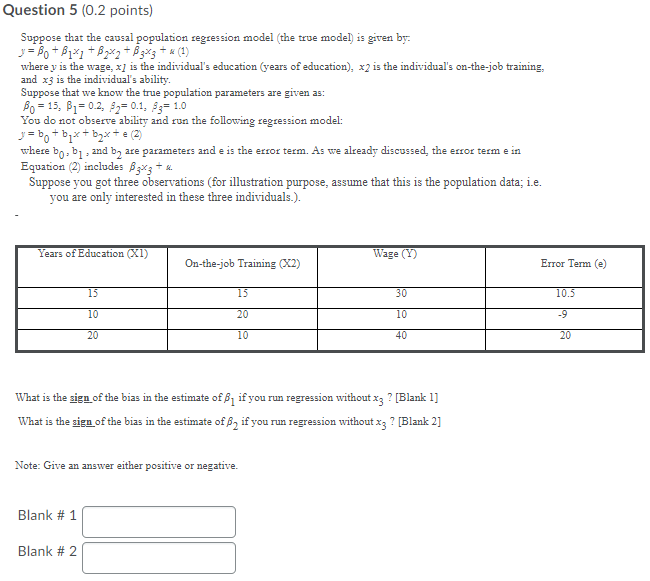
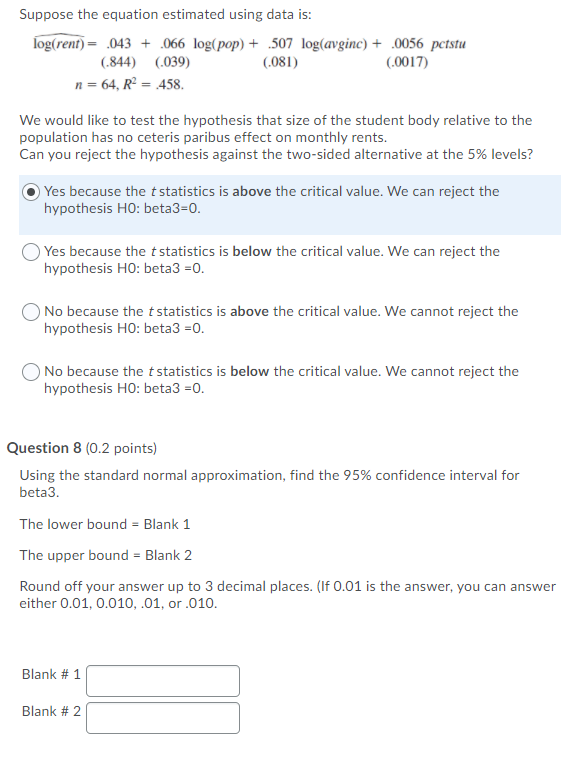
Question 5 (0.2 points) Suppose that the causal population regression model (the true model) is given by: y = B+B1+1+B772 +3343+ * (1) where y is the wage, x] is the individual's education (years of education), x2 is the individual's on-the-job training, and x3 is the individual's ability. Suppose that we know the true population parameters are given as: Bo = 15, B1= 0.2, 82=0.1. $z= 1.0 You do not observe ability and run the following regression model: u= bo+bqx+ b2x+e (2) where bo, 61, and by are parameters and e is the error term. As we already discussed, the error term e in Equation (2) includes B3x3 + Suppose you got three observations (for illustration purpose, assume that this is the population data; i.e. you are only interested in these three individuals.). = Years of Education (XI) Wage (Y) On-the-job Training (X2) Error Term (e) 15 15 30 10.3 10 20 10 -9 20 10 40 20 What is the sign of the bias in the estimate of B, if you run regression without xz ? [Blank 1] What is the sign of the bias in the estimate of B2 if you run regression without x3 ? [Blank 2] Note: Give an answer either positive or negative. Blank # 1 Blank # 2 Suppose the equation estimated using data is: log(rent) = .043 + .066 log(pop) + .507 log(avginc) + .0056 petstu (844) (039) (.081) (.0017) n=64, R2 = .458 We would like to test the hypothesis that size of the student body relative to the population has no ceteris paribus effect on monthly rents. Can you reject the hypothesis against the two-sided alternative at the 5% levels? Yes because the t statistics is above the critical value. We can reject the hypothesis Ho: beta3=0. Yes because the t statistics is below the critical value. We can reject the hypothesis HO: beta3 =0. No because the t statistics is above the critical value. We cannot reject the hypothesis Ho: beta3 =0. No because the t statistics is below the critical value. We cannot reject the hypothesis HO: beta3 =0. Question 8 (0.2 points) Using the standard normal approximation, find the 95% confidence interval for beta3. The lower bound = Blank 1 The upper bound = Blank 2 Round off your answer up to 3 decimal places. (If 0.01 is the answer, you can answer either 0.01, 0.010,.01, or .010. Blank # 1 Blank # 2Step by Step Solution
There are 3 Steps involved in it
1 Expert Approved Answer
Step: 1 Unlock

Question Has Been Solved by an Expert!
Get step-by-step solutions from verified subject matter experts
Step: 2 Unlock
Step: 3 Unlock