

Question: please answer both questions clearly 5) This graph represents Minutes Second 6.000 4000 s $20 560 580 580 5100 4000 6.000 Oprofit of a long
 please answer both questions clearly
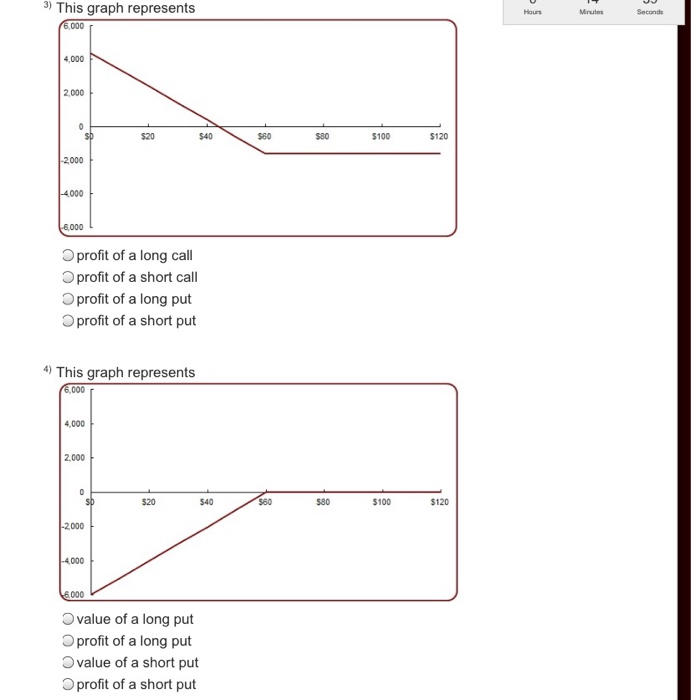
5) This graph represents Minutes Second 6.000 4000 s $20 560 580 580 5100 4000 6.000 Oprofit of a long call Oprofit of a short call Oprofit of a long put Oprofit of a short put 4) This graph represents 6,000 4.000 2.000 $20 540 70 s80 $100 2000 4000 8.000 value of a long put profit of a long put value of a short put Oprofit of a short put
Step by Step Solution
There are 3 Steps involved in it
1 Expert Approved Answer
Step: 1 Unlock

Question Has Been Solved by an Expert!
Get step-by-step solutions from verified subject matter experts
Step: 2 Unlock
Step: 3 Unlock