

Question: Please answer both questions QUESTION 3 Which of these chart types is most appropriate to visualize the relationship between three quantitative variables? Bar chart Pie
Please answer both questions
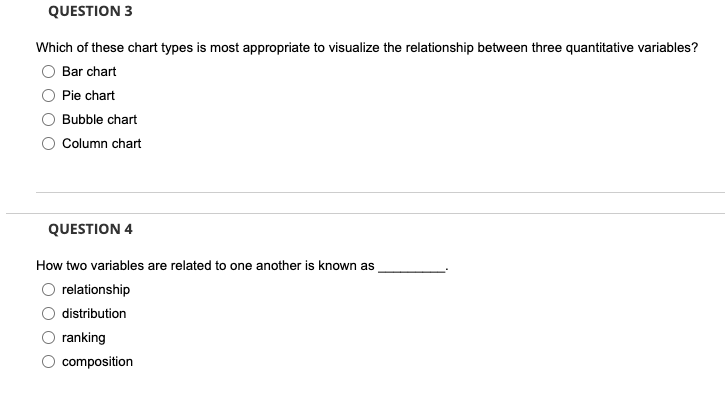
QUESTION 3 Which of these chart types is most appropriate to visualize the relationship between three quantitative variables? Bar chart Pie chart Bubble chart Column chart QUESTION 4 How two variables are related to one another is known as relationship distribution ranking compositionStep by Step Solution
There are 3 Steps involved in it
1 Expert Approved Answer
Step: 1 Unlock

Question Has Been Solved by an Expert!
Get step-by-step solutions from verified subject matter experts
Step: 2 Unlock
Step: 3 Unlock