

Question: Please answer correctly Thank you event Value Profiles for projects X and Y are shown in the following for. Assume that these two projects are
Please answer correctly Thank you
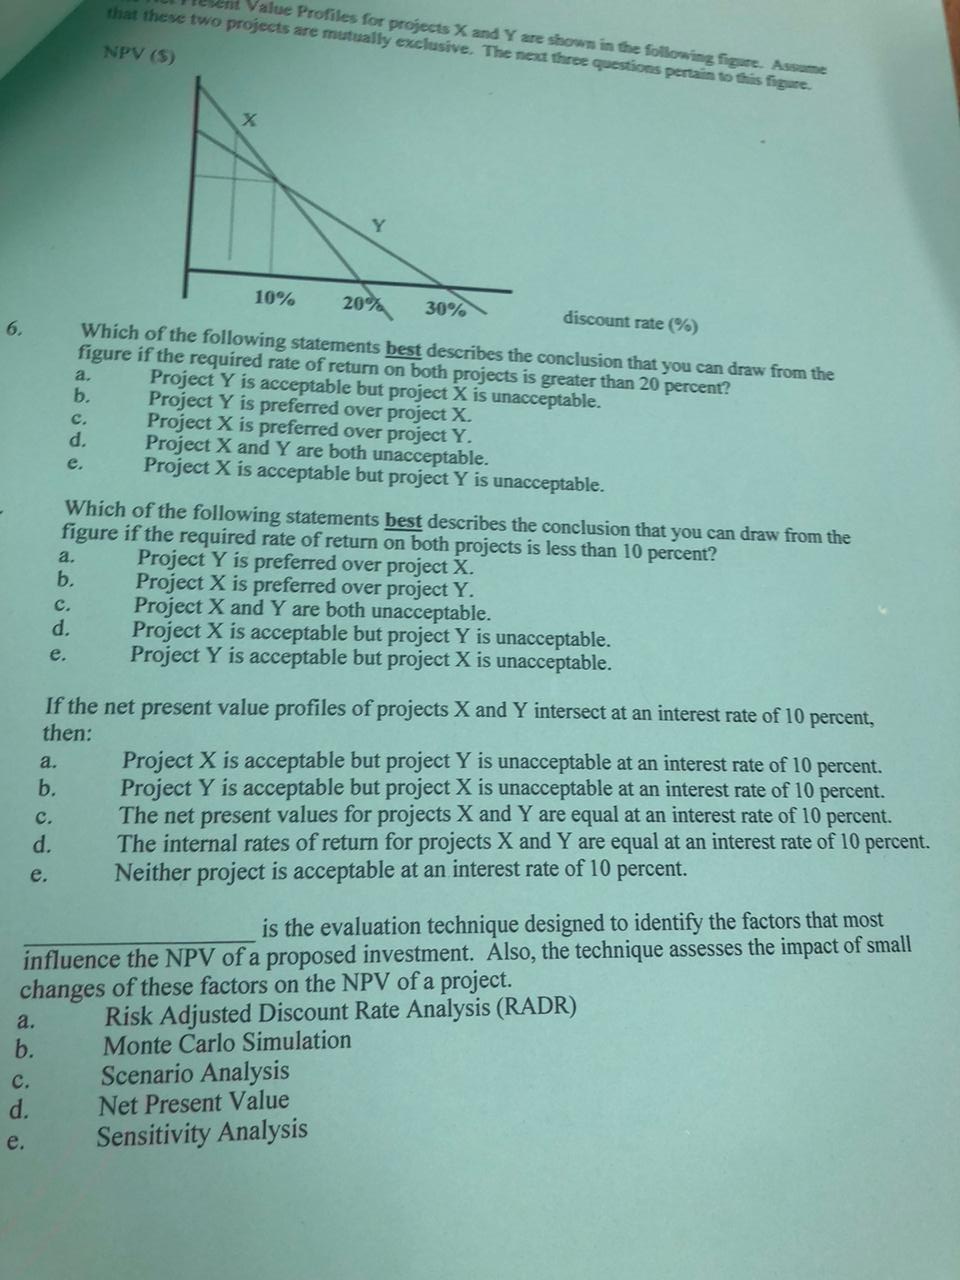
event Value Profiles for projects X and Y are shown in the following for. Assume that these two projects are mutually exclusive. The next three questions pertain to this figure NPV (5) 10% 20% 30% discount rate (%) Which of the following statements best describes the conclusion that you can draw from the figure if the required rate of return on both projects is greater than 20 percent? Project Y is acceptable but project X is unacceptable. Project Y is preferred over project X. Project X is preferred over project Y. Project X and Y are both unacceptable. Project X is acceptable but project Y is unacceptable. d. e. Which of the following statements best describes the conclusion that you can draw from the figure if the required rate of return on both projects is less than 10 percent? Project Y is preferred over project X. Project X is preferred over project Y. Project X and Y are both unacceptable. d. Project X is acceptable but project Y is unacceptable. Project Y is acceptable but project X is unacceptable. If the net present value profiles of projects X and Y intersect at an interest rate of 10 percent, then: Project X is acceptable but project Y is unacceptable at an interest rate of 10 percent. Project Y is acceptable but project X is unacceptable at an interest rate of 10 percent. The net present values for projects X and Y are equal at an interest rate of 10 percent. The internal rates of return for projects X and Y are equal at an interest rate of 10 percent. Neither project is acceptable at an interest rate of 10 percent. is the evaluation technique designed to identify the factors that most influence the NPV of a proposed investment. Also, the technique assesses the impact of small changes of these factors on the NPV of a project. Risk Adjusted Discount Rate Analysis (RADR) Monte Carlo Simulation Scenario Analysis Net Present Value Sensitivity Analysis
Step by Step Solution
There are 3 Steps involved in it

Get step-by-step solutions from verified subject matter experts