

Question: please answer Crowdmark Consider the following graphs (1) (2) 0.5 -1.57 -IT -0.57 0.57 1 1.57 2 T 2 TT -05 (3) (4) 0.5- -27
please answer
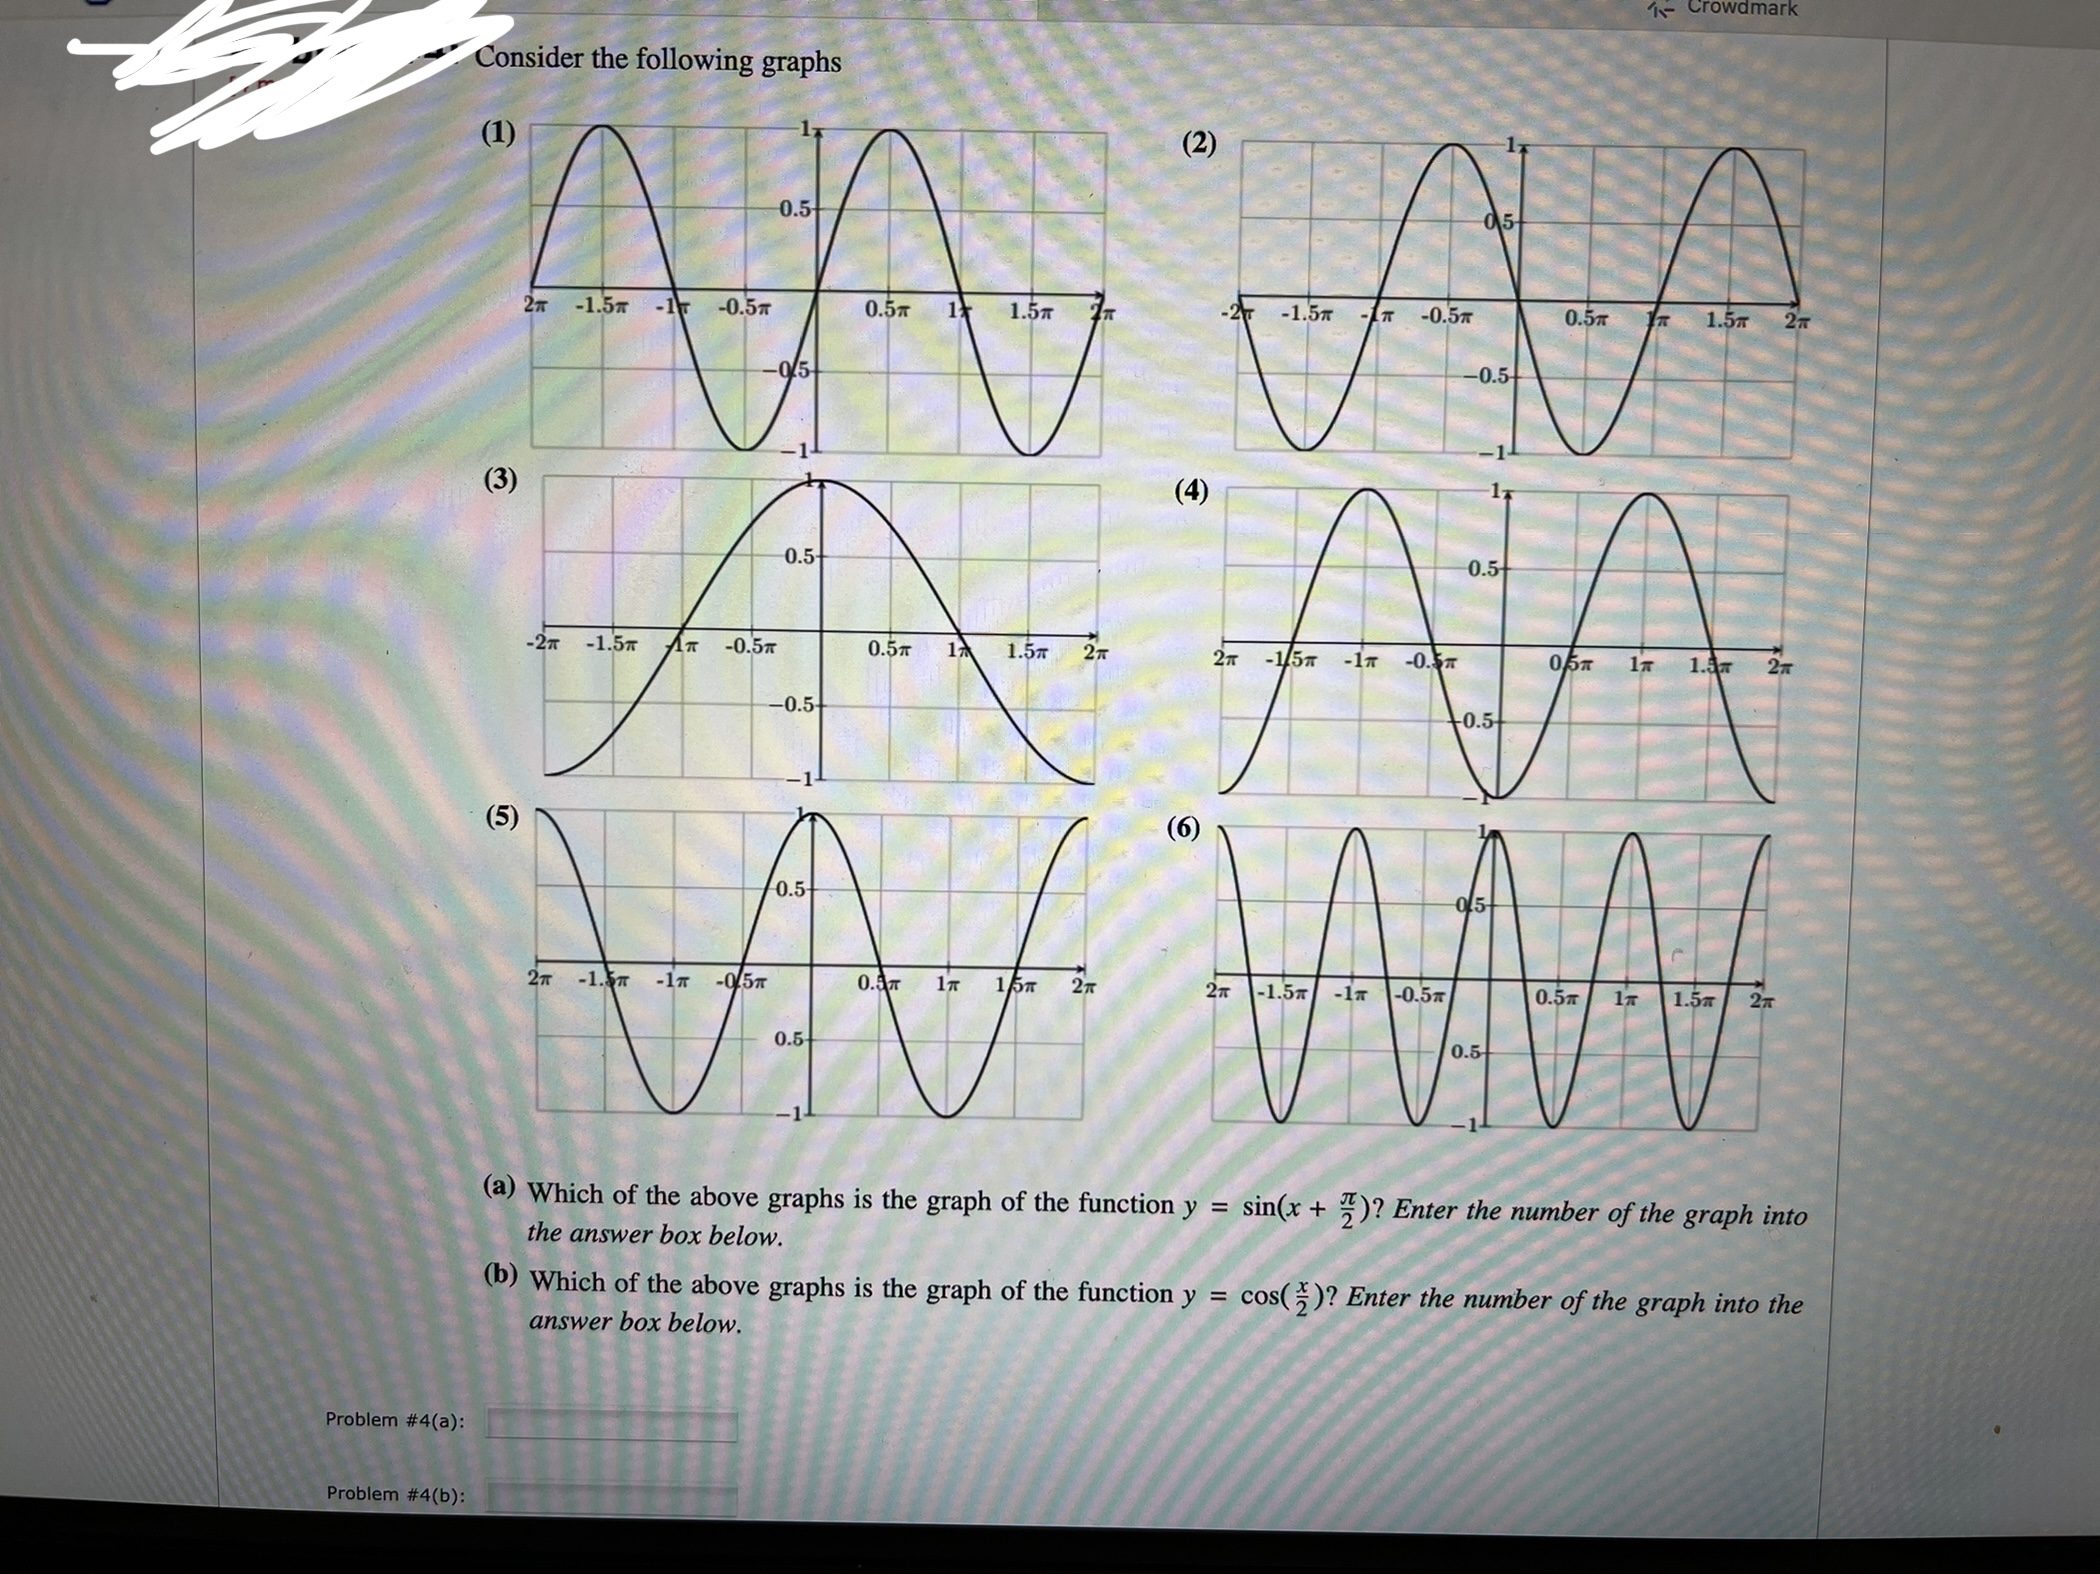
Crowdmark Consider the following graphs (1) (2) 0.5 -1.57 -IT -0.57 0.57 1 1.57 2 T 2 TT -05 (3) (4) 0.5- -27 -1.57 AT -0.57 0.5TT 17 1.57 27 -0.5 AA (5) 0.5- -17 -05T 2 T 0.5 (a) Which of the above graphs is the graph of the function y = sin(x + 2)? Enter the number of the graph into the answer box below. (b) Which of the above graphs is the graph of the function y = cos( 2 )? Enter the number of the graph into the answer box below. Problem #4(a): Problem #4(b)
Step by Step Solution
There are 3 Steps involved in it
1 Expert Approved Answer
Step: 1 Unlock

Question Has Been Solved by an Expert!
Get step-by-step solutions from verified subject matter experts
Step: 2 Unlock
Step: 3 Unlock