Question: Please answer each question separately. CASE STUDY Seven-Eleven Japan Co. Established by Ito Yokado in 1973, Seven-Eleven Japan request, Southland agreed in 1973 to a
Please answer each question separately.
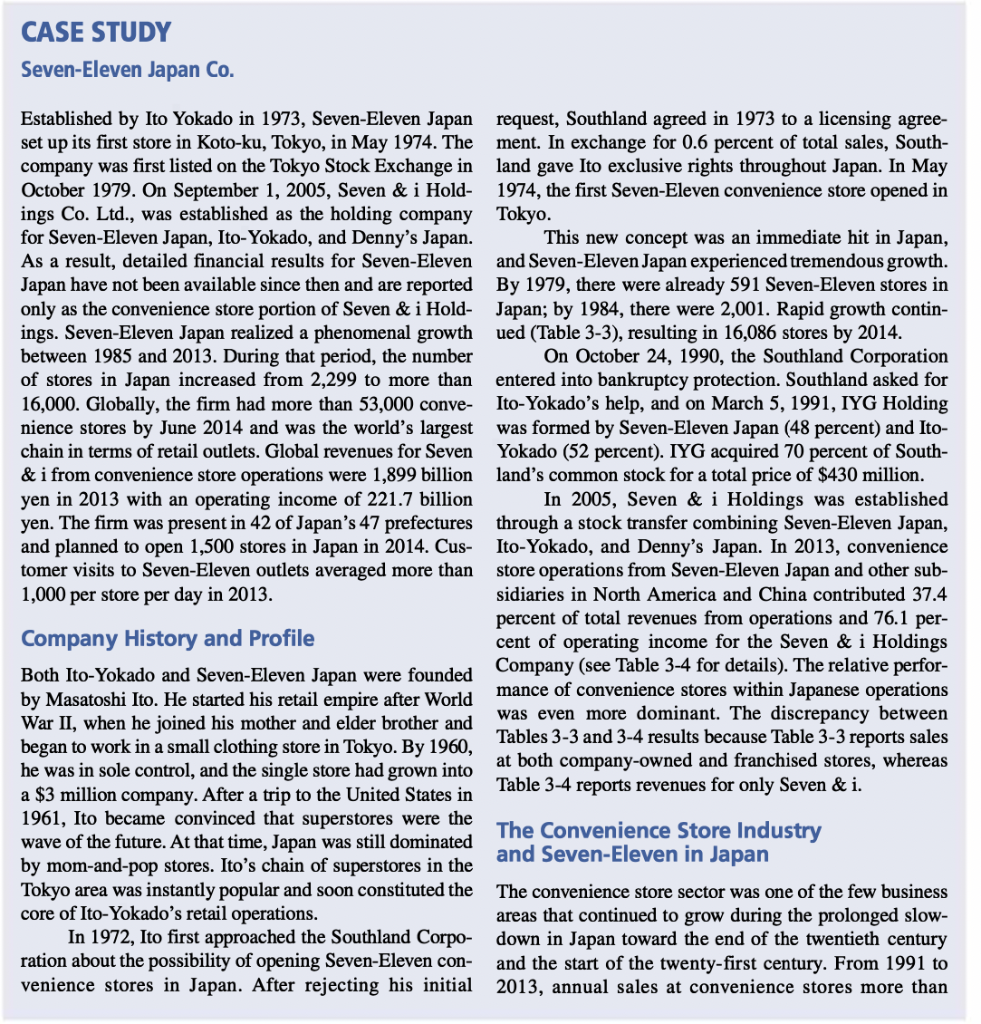
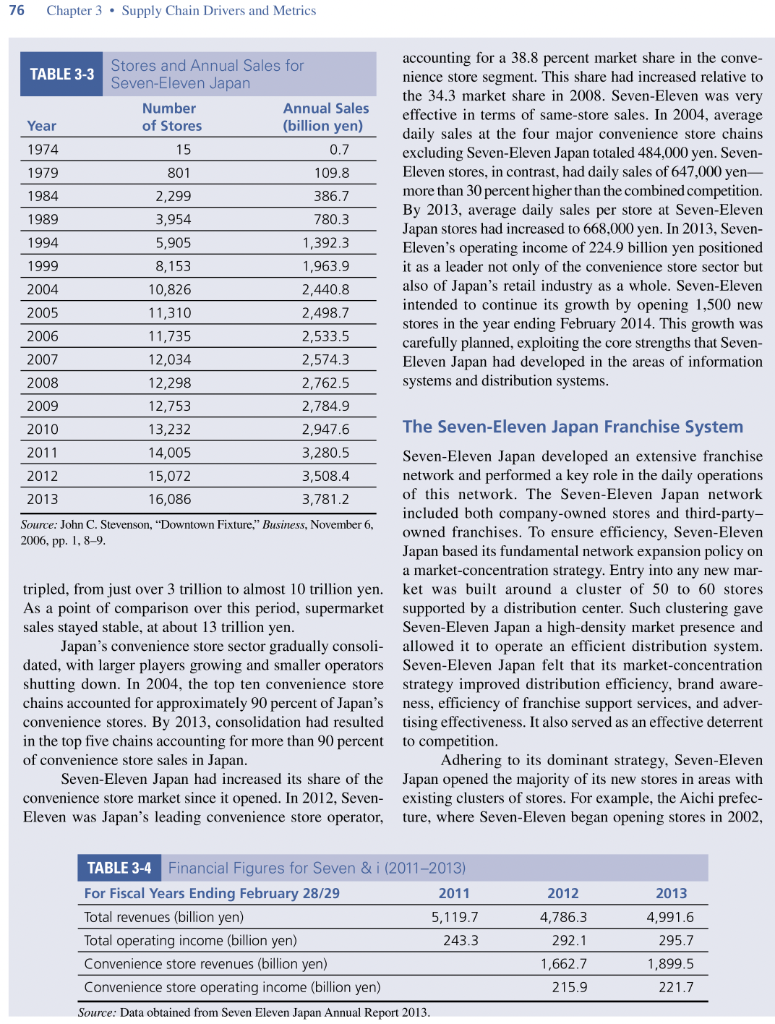
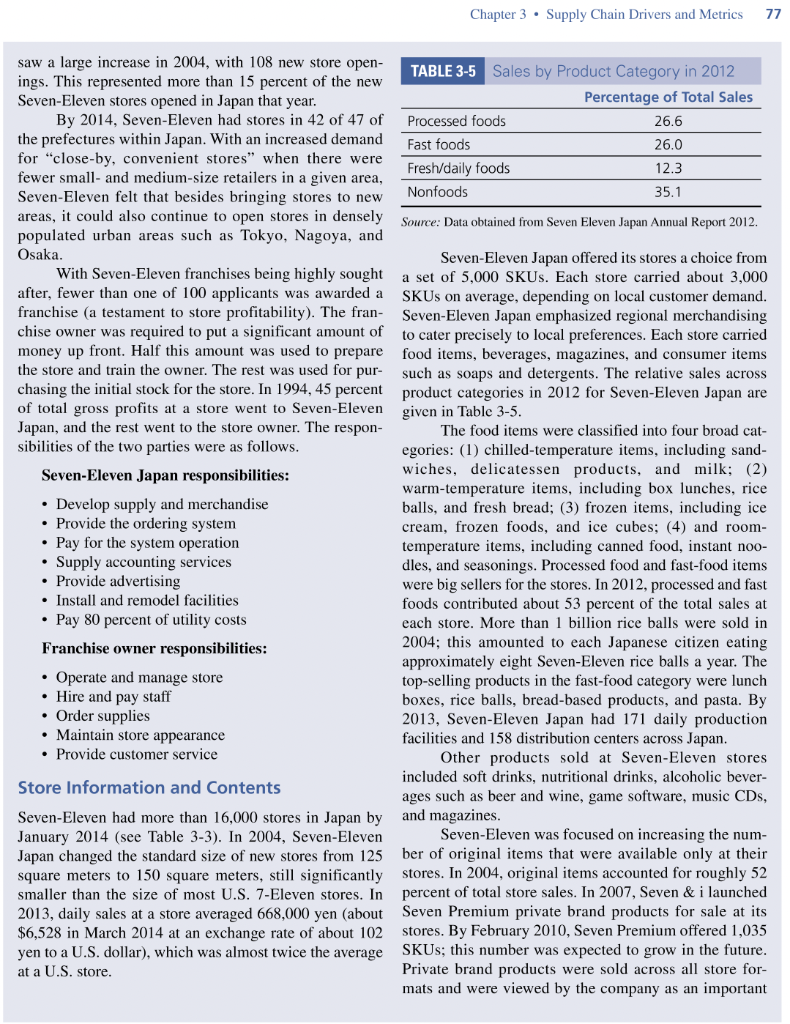
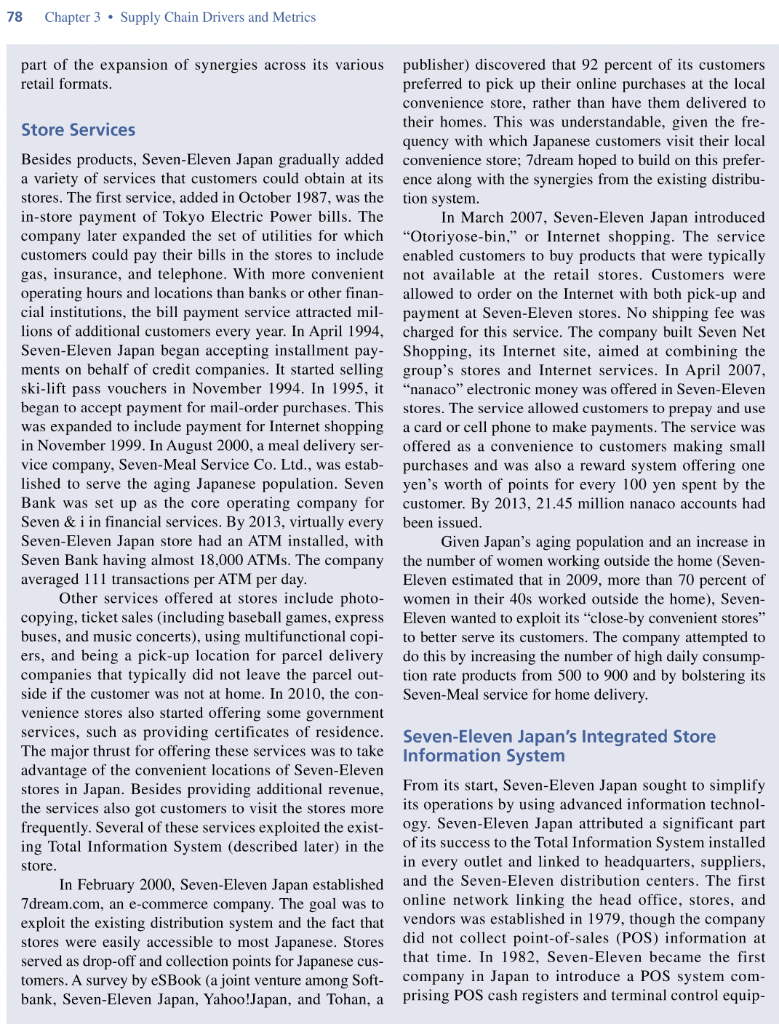
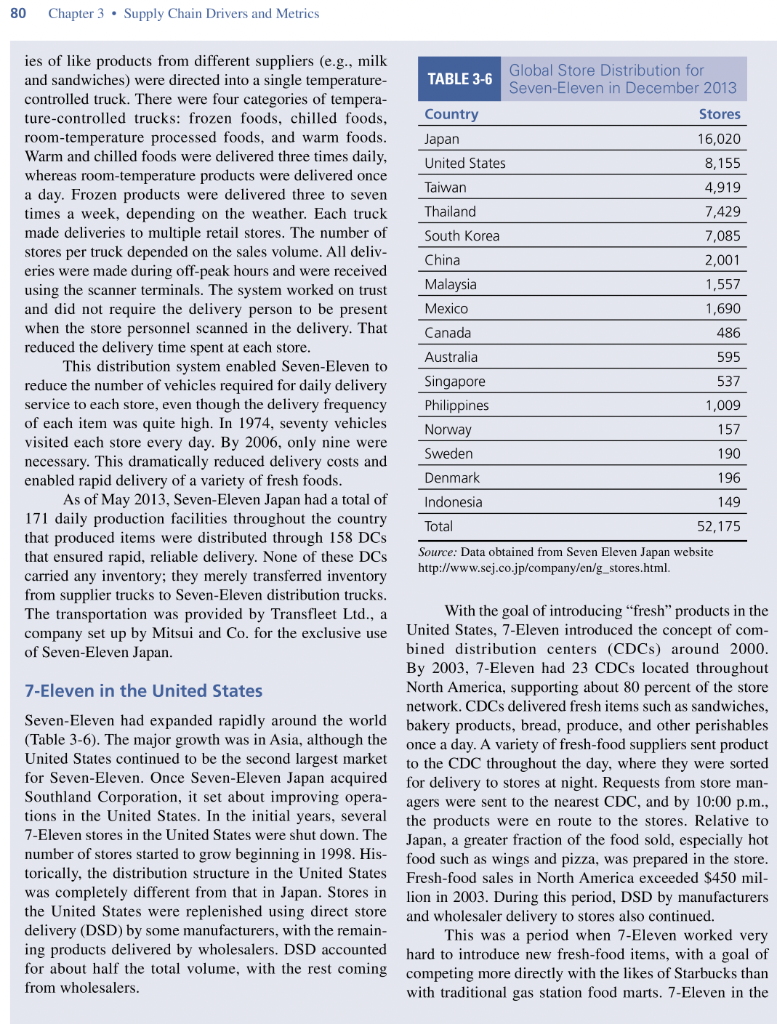
CASE STUDY Seven-Eleven Japan Co. Established by Ito Yokado in 1973, Seven-Eleven Japan request, Southland agreed in 1973 to a licensing agree- set up its first store in Koto-ku, Tokyo, in May 1974. The ment. In exchange for 0.6 percent of total sales, South- company was first listed on the Tokyo Stock Exchange in land gave Ito exclusive rights throughout Japan. In May October 1979. On September 1, 2005, Seven & i Hold- 1974, the first Seven-Eleven convenience store opened in ings Co. Ltd., was established as the holding company Tokyo. for Seven-Eleven Japan, Ito-Yokado, and Denny's Japan. This new concept was an immediate hit in Japan, As a result, detailed financial results for Seven-Eleven and Seven-Eleven Japan experienced tremendous growth. Japan have not been available since then and are reported By 1979, there were already 591 Seven-Eleven stores in only as the convenience store portion of Seven & i Hold- Japan; by 1984, there were 2,001. Rapid growth contin- ings. Seven-Eleven Japan realized a phenomenal growth ued (Table 3-3), resulting in 16,086 stores by 2014. between 1985 and 2013. During that period, the number On October 24, 1990, the Southland Corporation of stores in Japan increased from 2,299 to more than entered into bankruptcy protection. Southland asked for 16,000. Globally, the firm had more than 53,000 conve- Ito-Yokado's help, and on March 5, 1991, IYG Holding nience stores by June 2014 and was the world's largest was formed by Seven-Eleven Japan (48 percent) and Ito- chain in terms of retail outlets. Global revenues for Seven Yokado (52 percent). IYG acquired 70 percent of South- & i from convenience store operations were 1,899 billion land's common stock for a total price of $430 million. yen in 2013 with an operating income of 221.7 billion In 2005, Seven & i Holdings was established yen. The firm was present in 42 of Japan's 47 prefectures through a stock transfer combining Seven-Eleven Japan, and planned to open 1,500 stores in Japan in 2014. Cus- Ito-Yokado, and Denny's Japan. In 2013, convenience tomer visits to Seven-Eleven outlets averaged more than store operations from Seven-Eleven Japan and other sub- 1,000 per store per day in 2013. sidiaries in North America and China contributed 37.4 percent of total revenues from operations and 76.1 per- Company History and Profile cent of operating income for the Seven & i Holdings Both Ito-Yokado and Seven-Eleven Japan were founded Company (see Table 3-4 for details). The relative perfor- by Masatoshi Ito. He started his retail empire after World mance of convenience stores within Japanese operations War II, when he joined his mother and elder brother and was even more dominant. The discrepancy between Tables 3-3 and 3-4 results because Table 3-3 reports sales began to work in a small clothing store in Tokyo. By 1960, he was in sole control, and the single store had grown into at both company-owned and franchised stores, whereas a $3 million company. After a trip to the United States in Table 3-4 reports revenues for only Seven & i. 1961, Ito became convinced that superstores were the The Convenience Store Industry wave of the future. At that time, Japan was still dominated and Seven-Eleven in Japan by mom-and-pop stores. Ito's chain of superstores in the Tokyo area was instantly popular and soon constituted the The convenience store sector was one of the few business core of Ito-Yokado's retail operations. areas that continued to grow during the prolonged slow- In 1972, Ito first approached the Southland Corpo- down in Japan toward the end of the twentieth century ration about the possibility of opening Seven-Eleven con- and the start of the twenty-first century. From 1991 to venience stores in Japan. After rejecting his initial 2013, annual sales at convenience stores more than 76 Chapter 3 . Supply Chain Drivers and Metrics 2004 Stores and Annual Sales for accounting for a 38.8 percent market share in the conve- TABLE 3-3 Seven-Eleven Japan nience store segment. This share had increased relative to the 34.3 market share in 2008. Seven-Eleven was very Number Annual Sales effective in terms of same-store sales. In 2004, average Year of Stores (billion yen) daily sales at the four major convenience store chains 1974 15 0.7 excluding Seven-Eleven Japan totaled 484,000 yen. Seven- 1979 801 109.8 Eleven stores, in contrast, had daily sales of 647,000 yen- 1984 2,299 386.7 more than 30 percent higher than the combined competition. 1989 3,954 780.3 By 2013, average daily sales per store at Seven-Eleven Japan stores had increased to 668,000 yen. In 2013, Seven- 1994 5,905 1,392.3 Eleven's operating income of 224.9 billion yen positioned 1999 8,153 1,963.9 it as a leader not only of the convenience store sector but 10,826 2,440.8 also of Japan's retail industry as a whole. Seven-Eleven 2005 11,310 2,498.7 intended to continue its growth by opening 1,500 new stores in the year ending February 2014. This growth was 2006 11,735 2,533.5 carefully planned, exploiting the core strengths that Seven- 2007 12,034 2,574.3 Eleven Japan had developed in the areas of information 2008 12,298 2,762.5 systems and distribution systems. 2009 12,753 2,784.9 2010 13,232 2,947.6 The Seven-Eleven Japan Franchise System 2011 14,005 3,280.5 Seven-Eleven Japan developed an extensive franchise 15,072 3,508.4 network and performed a key role in the daily operations 2013 16,086 3,781.2 of this network. The Seven-Eleven Japan network included both company-owned stores and third-party- Source: John C. Stevenson, "Downtown Fixture, " Business, November 6, 2006, pp. 1, 8-9. owned franchises. To ensure efficiency, Seven-Eleven Japan based its fundamental network expansion policy on a market-concentration strategy. Entry into any new mar- tripled, from just over 3 trillion to almost 10 trillion yen. ket was built around a cluster of 50 to 60 stores As a point of comparison over this period, supermarket supported by a distribution center. Such clustering gave sales stayed stable, at about 13 trillion yen. Seven-Eleven Japan a high-density market presence and Japan's convenience store sector gradually consoli- allowed it to operate an efficient distribution system. dated, with larger players growing and smaller operators Seven-Eleven Japan felt that its market-concentration shutting down. In 2004, the top ten convenience store strategy improved distribution efficiency, brand aware- chains accounted for approximately 90 percent of Japan's ness, efficiency of franchise support services, and adver- convenience stores. By 2013, consolidation had resulted tising effectiveness. It also served as an effective deterrent in the top five chains accounting for more than 90 percent to competition. of convenience store sales in Japan. Adhering to its dominant strategy, Seven-Eleven Seven-Eleven Japan had increased its share of the Japan opened the majority of its new stores in areas with convenience store market since it opened. In 2012, Seven- existing clusters of stores. For example, the Aichi prefec- Eleven was Japan's leading convenience store operator, ture, where Seven-Eleven began opening stores in 2002, 2012 2012 2013 TABLE 3-4 Financial Figures for Seven & i (2011-2013) For Fiscal Years Ending February 28/29 2011 Total revenues (billion yen) 5,119.7 Total operating income (billion yen) 243.3 Convenience store revenues (billion yen) Convenience store operating income (billion yen) Source: Data obtained from Seven Eleven Japan Annual Report 2013. 4,786.3 292.1 1,662.7 215.9 4,991.6 295.7 1,899.5 221.7 Chapter 3 . Supply Chain Drivers and Metrics 77 saw a large increase in 2004, with 108 new store open- ings. This represented more than 15 percent of the new TABLE 3-5 Sales by Product Category in 2012 Seven-Eleven stores opened in Japan that year. Percentage of Total Sales By 2014, Seven-Eleven had stores in 42 of 47 of Processed foods 26.6 the prefectures within Japan. With an increased demand Fast foods 26.0 for "close-by, convenient stores" when there were 12.3 fewer small- and medium-size retailers in a given area, Fresh/daily foods Seven-Eleven felt that besides bringing stores to new Nonfoods 35.1 areas, it could also continue to open stores in densely Source: Data obtained from Seven Eleven Japan Annual Report 2012. populated urban areas such as Tokyo, Nagoya, and Osaka. Seven-Eleven Japan offered its stores a choice from With Seven-Eleven franchises being highly sought a set of 5,000 SKUs. Each store carried about 3,000 after, fewer than one of 100 applicants was awarded a SKUs on average, depending on local customer demand. franchise (a testament to store profitability). The fran- Seven-Eleven Japan emphasized regional merchandising chise owner was required to put a significant amount of to cater precisely to local preferences. Each store carried money up front. Half this amount was used to prepare food items, beverages, magazines, and consumer items the store and train the owner. The rest was used for pur- such as soaps and detergents. The relative sales across chasing the initial stock for the store. In 1994, 45 percent product categories in 2012 for Seven-Eleven Japan are of total gross profits at a store went to Seven-Eleven given in Table 3-5. Japan, and the rest went to the store owner. The respon- The food items were classified into four broad cat- sibilities of the two parties were as follows. egories: (1) chilled-temperature items, including sand- Seven-Eleven Japan responsibilities: wiches, delicatessen products, and milk; (2) warm-temperature items, including box lunches, rice Develop supply and merchandise balls, and fresh bread; (3) frozen items, including ice Provide the ordering system cream, frozen foods, and ice cubes; (4) and room- Pay for the system operation temperature items, including canned food, instant noo- Supply accounting services dles, and seasonings. Processed food and fast-food items Provide advertising were big sellers for the stores. In 2012, processed and fast Install and remodel facilities foods contributed about 53 percent of the total sales at Pay 80 percent of utility costs each store. More than 1 billion rice balls were sold in Franchise owner responsibilities: 2004; this amounted to each Japanese citizen eating approximately eight Seven-Eleven rice balls a year. The Operate and manage store top-selling products in the fast-food category were lunch Hire and pay staff boxes, rice balls, bread-based products, and pasta. By Order supplies 2013, Seven-Eleven Japan had 171 daily production Maintain store appearance facilities and 158 distribution centers across Japan. Provide customer service Other products sold at Seven-Eleven stores included soft drinks, nutritional drinks, alcoholic bever- Store Information and Contents ages such as beer and wine, game software, music CDs, Seven-Eleven had more than 16,000 stores in Japan by and magazines January 2014 (see Table 3-3). In 2004, Seven-Eleven Seven-Eleven was focused on increasing the num- Japan changed the standard size of new stores from 125 ber of original items that were available only at their square meters to 150 square meters, still significantly stores. In 2004, original items accounted for roughly 52 smaller than the size of most U.S. 7-Eleven stores. In percent of total store sales. In 2007, Seven & i launched 2013, daily sales at a store averaged 668,000 yen (about Seven Premium private brand products for sale at its $6,528 in March 2014 at an exchange rate of about 102 stores. By February 2010, Seven Premium offered 1,035 yen to a U.S. dollar), which was almost twice the average SKUs; this number was expected to grow in the future. at a U.S. store. Private brand products were sold across all store for- mats and were viewed by the company as an important 78 Chapter 3 . Supply Chain Drivers and Metrics part of the expansion of synergies across its various publisher) discovered that 92 percent of its customers retail formats. preferred to pick up their online purchases at the local convenience store, rather than have them delivered to Store Services their homes. This was understandable, given the fre- quency with which Japanese customers visit their local Besides products, Seven-Eleven Japan gradually added convenience store; 7dream hoped to build on this prefer- a variety of services that customers could obtain at its ence along with the synergies from the existing distribu- stores. The first service, added in October 1987, was the tion system. in-store payment of Tokyo Electric Power bills. The In March 2007, Seven-Eleven Japan introduced company later expanded the set of utilities for which Otoriyose-bin," or Internet shopping. The service customers could pay their bills in the stores to include enabled customers to buy products that were typically gas, insurance, and telephone. With more convenient not available at the retail stores. Customers were operating hours and locations than banks or other finan- allowed to order on the Internet with both pick-up and cial institutions, the bill payment service attracted mil- payment at Seven-Eleven stores. No shipping fee was lions of additional customers every year. In April 1994, charged for this service. The company built Seven Net Seven-Eleven Japan began accepting installment pay- Shopping, its Internet site, aimed at combining the ments on behalf of credit companies. It started selling group's stores and Internet services. In April 2007, ski-lift pass vouchers in November 1994. In 1995, it "nanaco" electronic money was offered in Seven-Eleven began to accept payment for mail-order purchases. This stores. The service allowed customers to prepay and use was expanded to include payment for Internet shopping a card or cell phone to make payments. The service was in November 1999. In August 2000, a meal delivery ser- offered as a convenience to customers making small vice company, Seven-Meal Service Co. Ltd., was estab- purchases and was also a reward system offering one lished to serve the aging Japanese population. Seven yen's worth of points for every 100 yen spent by the Bank was set up as the core operating company for customer. By 2013, 21.45 million nanaco accounts had Seven &i in financial services. By 2013, virtually every been issued. Seven-Eleven Japan store had an ATM installed, with Given Japan's aging population and an increase in Seven Bank having almost 18,000 ATMs. The company the number of women working outside the home (Seven- averaged 111 transactions per ATM per day. Eleven estimated that in 2009, more than 70 percent of Other services offered at stores include photo- women in their 40s worked outside the home), Seven- copying, ticket sales (including baseball games, express Eleven wanted to exploit its "close-by convenient stores buses, and music concerts), using multifunctional copi- to better serve its customers. The company attempted to ers, and being a pick-up location for parcel delivery do this by increasing the number of high daily consump- companies that typically did not leave the parcel out- tion rate products from 500 to 900 and by bolstering its side if the customer was not at home. In 2010, the con- Seven-Meal service for home delivery. venience stores also started offering some government services, such as providing certificates of residence. Seven-Eleven Japan's Integrated Store The major thrust for offering these services was to take Information System advantage of the convenient locations of Seven-Eleven stores in Japan. Besides providing additional revenue. From its start, Seven-Eleven Japan sought to simplify the services also got customers to visit the stores more its operations by using advanced information technol- frequently. Several of these services exploited the exist- ogy. Seven-Eleven Japan attributed a significant part ing Total Information System (described later) in the of its success to the Total Information System installed store. in every outlet and linked to headquarters, suppliers, In February 2000, Seven-Eleven Japan established and the Seven-Eleven distribution centers. The first 7 dream.com, an e-commerce company. The goal was to online network linking the head office, stores, and exploit the existing distribution system and the fact that vendors was established in 1979, though the company stores were easily accessible to most Japanese. Stores did not collect point-of-sales (POS) information at served as drop-off and collection points for Japanese cus- that time. In 1982, Seven-Eleven became the first tomers. A survey by eSBook (a joint venture among Soft- company in Japan to introduce a POS system com- bank, Seven-Eleven Japan, Yahoo!Japan, and Tohan, a prising POS cash registers and terminal control equip- Chapter 3 . Supply Chain Drivers and Metrics 79 ment. In 1985, the company, jointly with NEC, Store computer: This linked to the Seven-Eleven developed personal computers using color graphics network, the POS register, the graphic order termi- that were installed at each store and linked to the POS nal, and the scanner terminal. It communicated cash registers. These computers were also on the net- among the various input sources, tracked store work linking the store to the head office, as well as inventory and sales, placed orders, provided the vendors. Until July 1991, the head office, stores, detailed analysis of POS data, and maintained and distribution centers, and suppliers were linked only by regulated store equipment. a traditional analog network. At that time, an inte- POS register: As soon as a customer purchased grated services digital network (ISDN) was installed. an item and paid at the POS register, sales and other Linking more than 5,000 stores, it became one of the data (such as the age and sex of the customer) were world's largest ISDN systems at that time. Sales data stored and transmitted to headquarters through the gathered in each store by 11:00 p.m. were processed store computer. and ready for analysis the next morning. The hardware system at a 2012 Seven-Eleven store The analyzed and updated data were then sent back included the following: to the Seven-Eleven Japan stores via the network each Graphic order terminal: This was a handheld morning. All this information was available on the device with a wide-screen graphic display, used graphic order terminal with the objective of improving by the store owner or manager to place orders. order placement. The store manager/owner walked down the aisles The information system allowed Seven-Eleven and placed orders by item. When placing an order, stores to better match supply with demand. Store staff the store manager had access (from the store com- could adjust the merchandising mix on the shelves puter) to detailed analysis of POS data related to according to consumption patterns throughout the day. the particular item. This included sales analysis of For example, popular breakfast items were stocked ear- product categories and SKUs over time, analysis lier during the day, and popular dinner items were of waste, 10-week sales trends by SKU, 10-day stocked later in the evening. The identification of slow sales trends by SKU, sales trends for new prod- and nonmoving items allowed a store to convert shelf ucts, sales analysis by day and time, list of slow- space to introduce new items. About 70 percent of the moving items, analysis of sales and number of items sold at a Seven-Eleven store changed in the customers over time, contribution of product to course of a year. About 100 new products were intro- sections in store display, and sales growth by duced each week. When a new product was introduced, product categories. The store manager used this the decision whether to continue stocking it was made information when placing an order, which was within the first three weeks. Each item on the shelf con- entered directly into the terminal. Once all the tributed to sales and margin and did not waste valuable orders were placed, the terminal was returned to its slot, at which point the orders were relayed by the store computer to both the appropriate vendor Seven-Eleven's Distribution System and the Seven-Eleven distribution center. Scanner terminal: These scanners read bar The Seven-Eleven distribution system tightly linked the codes and recorded inventory. They were used to entire supply chain for all product categories. All stores receive products coming in from a distribution were given cutoff times for breakfast, lunch, and dinner center. This was automatically checked against a ordering. When a store placed an order, it was immedi- previously placed order, and the two were recon- ately transmitted to the supplier as well as the distribution ciled. Before the scanner terminals were intro- center. The supplier received orders from all Seven- duced, truck drivers waited in the store until the Eleven stores and started production to fill the orders. delivery was checked. Once they were introduced, The supplier then sent the orders by truck to the DC. the driver simply dropped the delivery in the store, Each store order was separated so the DC could easily and a store clerk received it at a suitable time when assign it to the appropriate store truck using the order there were few customers. The scanner terminals information it already had. were also used when examining inventory at The key to store delivery was what Seven-Eleven stores. called the combined delivery system. At the DC, deliver- shelf space. 80 Chapter 3 . Supply Chain Drivers and Metrics ies of like products from different suppliers (e.g., milk Global Store Distribution for and sandwiches) were directed into a single temperature- TABLE 3-6 Seven-Eleven in December 2013 controlled truck. There were four categories of tempera- ture-controlled trucks: frozen foods, chilled foods, Country Stores room-temperature processed foods, and warm foods. Japan 16,020 Warm and chilled foods were delivered three times daily, United States 8,155 whereas room-temperature products were delivered once Taiwan 4,919 a day. Frozen products were delivered three to seven times a week, depending on the weather. Each truck Thailand 7,429 made deliveries to multiple retail stores. The number of South Korea 7,085 stores per truck depended on the sales volume. All deliv- China 2,001 eries were made during off-peak hours and were received using the scanner terminals. The system worked on trust Malaysia 1,557 and did not require the delivery person to be present Mexico 1,690 when the store personnel scanned in the delivery. That Canada 486 reduced the delivery time spent at each store. Australia 595 This distribution system enabled Seven-Eleven to reduce the number of vehicles required for daily delivery Singapore 537 service to each store, even though the delivery frequency Philippines 1,009 of each item was quite high. In 1974, seventy vehicles Norway 157 visited each store every day. By 2006, only nine were Sweden 190 reduced necessary. This dramatica ivery costs and enabled rapid delivery of a variety of fresh foods. Denmark 196 As of May 2013, Seven-Eleven Japan had a total of Indonesia 149 171 daily production facilities throughout the country Total 52,175 that produced items were distributed through 158 DCS that ensured rapid, reliable delivery. None of these DCS Source: Data obtained from Seven Eleven Japan website carried any inventory; they merely transferred inventory http://www.sej.co.jp/company/en/g_stores.html. from supplier trucks to Seven-Eleven distribution trucks. The transportation was provided by Transfleet Ltd., a With the goal of introducing "fresh" products in the company set up by Mitsui and Co. for the exclusive use United States, 7-Eleven introduced the concept of com- of Seven-Eleven Japan. bined distribution centers (CDCs) around 2000. By 2003, 7-Eleven had 23 CDCs located throughout 7-Eleven in the United States North America, supporting about 80 percent of the store network. CDCs delivered fresh items such as sandwiches, Seven-Eleven had expanded rapidly around the world bakery products, bread, produce, and other perishables (Table 3-6). The major growth was in Asia, although the once a day. A variety of fresh-food suppliers sent product United States continued to be the second largest market to the CDC throughout the day, where they were sorted for Seven-Eleven. Once Seven-Eleven Japan acquired for delivery to stores at night. Requests from store man- Southland Corporation, it set about improving opera- agers were sent to the nearest CDC, and by 10:00 p.m., tions in the United States. In the initial years, several the products were en route to the stores. Relative to 7-Eleven stores in the United States were shut down. The Japan, a greater fraction of the food sold, especially hot number of stores started to grow beginning in 1998. His- food such as wings and pizza, was prepared in the store. torically, the distribution structure in the United States Fresh-food sales in North America exceeded $450 mil- was completely different from that in Japan. Stores in lion in 2003. During this period, DSD by manufacturers the United States were replenished using direct store and wholesaler delivery to stores also continued. delivery (DSD) by some manufacturers, with the remain- This was a period when 7-Eleven worked very ing products delivered by wholesalers. DSD accounted hard to introduce new fresh-food items, with a goal of for about half the total volume, with the rest coming competing more directly with the likes of Starbucks than from wholesalers. with traditional gas station food marts. 7-Eleven in the Chapter 3 Supply Chain Drivers and Metrics 81 United States had more than 63 percent of its sales from non-gasoline products compared with the rest of the industry, for which this number was closer to 35 percent. The goal was to continue to increase sales in the fresh- food and fast-food categories with a special focus on hot foods. In 2009, revenue in the United States and Canada totaled $16.0 billion, with about 63 percent coming from merchandise and the rest from the sale of gasoline. The North American inventory turnover rate in 2004 was about 19, compared to more than 50 in Japan. This, how- ever, represented a significant improvement in North American performance, where inventory turns in 1992 were around 12. using rapid replenishment. What are some risks associated with this choice? 3. What has Seven-Eleven done in its choice of facility loca- tion, inventory management, transportation, and informa- tion infrastructure to develop capabilities that support its supply chain strategy in Japan? 4. Seven-Eleven does not allow direct store delivery in Japan but has all products flow through its distribution center. What benefit does Seven-Eleven derive from this policy? When is direct store delivery more appropriate? 5. What do you think about the dream concept for Seven- Eleven Japan? From a supply chain perspective, is it likely to be more successful in Japan or the United States? Why? 6. Seven-Eleven is attempting to duplicate the supply chain that has succeeded in Japan and the United States with the introduction of CDCs. What are the pros and cons of this approach? Keep in mind that stores are also replenished by wholesalers and DSD by manufac- turers. 7. The United States has food service distributors that also replenish convenience stores. What are the pros and cons to having a distributor replenish convenience stores versus a company like Seven-Eleven managing its own distribution function? Study Questions 1. A convenience store chain attempts to be responsive and provide customers with what they need, when they need it, where they need it. What are some different ways that a convenience store supply chain can be responsive? What are some risks in each case? 2. Seven-Eleven's supply chain strategy in Japan can be described as attempting to micro-match supply and demand


