

Question: PLEASE ANSWER EACH QUESTION SEPARATELY. SEE CHART BELOW. 1. A basic accounting equation is Assets less Liabilities equals Equity. 2. What is the equity for
PLEASE ANSWER EACH QUESTION SEPARATELY. SEE CHART BELOW.
1. A basic accounting equation is Assets less Liabilities equals Equity.
2. What is the equity for 2003?
3. The owners equity increases each year from 1999-2003. How is that possible when the assets for 2001 are down from the previous year?
4. What other issues do you observe in regard to this information?
5. What would you do if you do not have sufficient background to understand financial statements?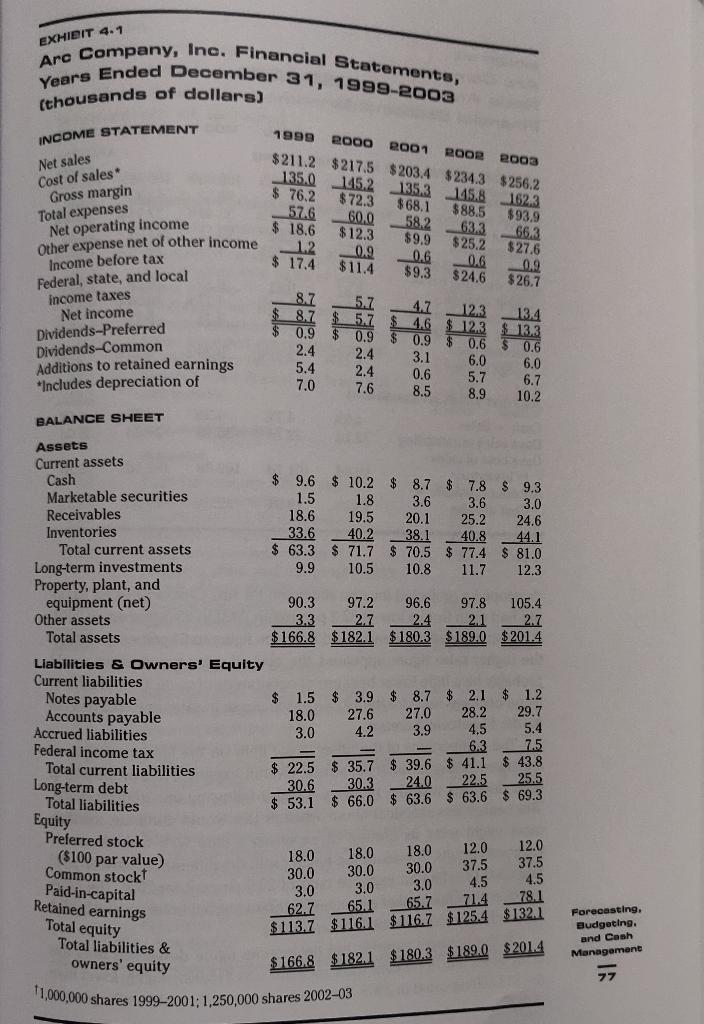
EXHIBIT 4-1 Arc Company, Inc. Financial Statements, Years Ended December 31, 1999-2003 (thousands of dollars) INCOME STATEMENT Net sales Cost of sales Gross margin Total expenses Net operating income Other expense net of other income Income before tax Federal, state, and local income taxes Net income Dividends-Preferred Dividends-Common Additions to retained earnings *Includes depreciation of BALANCE SHEET Assets Current assets Cash Marketable securities Receivables Inventories Total current assets Long-term investments Property, plant, and equipment (net) Other assets Total assets Liabilities & Owners' Equity Current liabilities Notes payable Accounts payable Accrued liabilities Federal income tax Total current liabilities Long-term debt Total liabilities Equity Preferred stock 1999 2000 2001 ROOR 2003 $211.2 $217.5 $203.4 $234.3 $256.2 145.2 135.3 145.8 135.0 $ 76.2 $72.3 $68.1 $88.5 57.6 $18.6 ($100 par value) 1.2 $17.4 8.7 8.7 0.9 2.4 5.4 7.0 $9.6 1.5 18.6 33.6 $63.3 9.9 60.0 $12.3 0.9 $11.4 5.7 18.0 3.0 2.4 2.4 7.6 $10.2 $ 1.8 19.5 40.2 90.3 97.2 3.3 2.7 $166.8 $182.1 $ 1.5 $ 3.9 58.2 $9.9 18.0 18.0 Common stock 30.0 30.0 3.0 3.0 Paid-in-capital Retained earnings Total equity Total liabilities & 62.7 65.1 $113.7 $116.1 owners' equity $166.8 $182.1 11,000,000 shares 1999-2001; 1,250,000 shares 2002-03 0.6 0.6 $9.3 $24.6 4.7 4.6 0.9 3.1 0.6 8.5 63.3 $25.2 27.6 27.0 4.2 3.9 12.3 $12.3 8.7 $ 7.8 $ 9.3 3.6 3.6 3.0 20.1 25.2 24.6 38.1 40.8 44.1 $71.7 $ 70.5 $77.4 $81.0 10.5 10.8 11.7 12.31 $22.5 $35.7 $39.6 30.3 24.0 30.6 $53.1 $66.0 $63.6 $ 0.6 6.0 5.7 8.9 96.6 2.4 2.1 $180.3 $189.0 $ 8.7 $2.1 162.3 $93.9 66.3 $27.6 0.9 $26.7 13.4 $13.3 $0.6 6.0 6.7 10.2 97.8 105.4 2.7 $201.4 $1.2 28.2 29.7 4,5 5.4 6.3 7.5 $ 41.1 $43.8 25.5 22.5 $63.6 $69.3 18.0 12.0 12.0 30.0 37.5 37.5 3.0 4.5 4.5 65.7 71.4 78.1 $116.7 $125.4 $132.1 $180.3 $189.0 $201.4 Forecasting, Budgeting. and Cash Management 77 EXHIBIT 4-1 Arc Company, Inc. Financial Statements, Years Ended December 31, 1999-2003 (thousands of dollars) INCOME STATEMENT Net sales Cost of sales Gross margin Total expenses Net operating income Other expense net of other income Income before tax Federal, state, and local income taxes Net income Dividends-Preferred Dividends-Common Additions to retained earnings *Includes depreciation of BALANCE SHEET Assets Current assets Cash Marketable securities Receivables Inventories Total current assets Long-term investments Property, plant, and equipment (net) Other assets Total assets Liabilities & Owners' Equity Current liabilities Notes payable Accounts payable Accrued liabilities Federal income tax Total current liabilities Long-term debt Total liabilities Equity Preferred stock 1999 2000 2001 ROOR 2003 $211.2 $217.5 $203.4 $234.3 $256.2 145.2 135.3 145.8 135.0 $ 76.2 $72.3 $68.1 $88.5 57.6 $18.6 ($100 par value) 1.2 $17.4 8.7 8.7 0.9 2.4 5.4 7.0 $9.6 1.5 18.6 33.6 $63.3 9.9 60.0 $12.3 0.9 $11.4 5.7 18.0 3.0 2.4 2.4 7.6 $10.2 $ 1.8 19.5 40.2 90.3 97.2 3.3 2.7 $166.8 $182.1 $ 1.5 $ 3.9 58.2 $9.9 18.0 18.0 Common stock 30.0 30.0 3.0 3.0 Paid-in-capital Retained earnings Total equity Total liabilities & 62.7 65.1 $113.7 $116.1 owners' equity $166.8 $182.1 11,000,000 shares 1999-2001; 1,250,000 shares 2002-03 0.6 0.6 $9.3 $24.6 4.7 4.6 0.9 3.1 0.6 8.5 63.3 $25.2 27.6 27.0 4.2 3.9 12.3 $12.3 8.7 $ 7.8 $ 9.3 3.6 3.6 3.0 20.1 25.2 24.6 38.1 40.8 44.1 $71.7 $ 70.5 $77.4 $81.0 10.5 10.8 11.7 12.31 $22.5 $35.7 $39.6 30.3 24.0 30.6 $53.1 $66.0 $63.6 $ 0.6 6.0 5.7 8.9 96.6 2.4 2.1 $180.3 $189.0 $ 8.7 $2.1 162.3 $93.9 66.3 $27.6 0.9 $26.7 13.4 $13.3 $0.6 6.0 6.7 10.2 97.8 105.4 2.7 $201.4 $1.2 28.2 29.7 4,5 5.4 6.3 7.5 $ 41.1 $43.8 25.5 22.5 $63.6 $69.3 18.0 12.0 12.0 30.0 37.5 37.5 3.0 4.5 4.5 65.7 71.4 78.1 $116.7 $125.4 $132.1 $180.3 $189.0 $201.4 Forecasting, Budgeting. and Cash Management 77
Step by Step Solution
There are 3 Steps involved in it

Get step-by-step solutions from verified subject matter experts