Question: PLEASE ANSWER F,G,H ONLY obs wage educ exper tenure 1 12.53 12 3 1 2 13.43 12 17 0 3 13.50 8 31 30 4
PLEASE ANSWER F,G,H ONLY

| obs | wage | educ | exper | tenure |
| 1 | 12.53 | 12 | 3 | 1 |
| 2 | 13.43 | 12 | 17 | 0 |
| 3 | 13.50 | 8 | 31 | 30 |
| 4 | 13.50 | 12 | 11 | 1 |
| 5 | 13.63 | 12 | 18 | 0 |
| 6 | 13.67 | 10 | 1 | 0 |
| 7 | 13.75 | 11 | 2 | 1 |
| 8 | 13.96 | 11 | 38 | 3 |
| 9 | 14.00 | 12 | 3 | 2 |
| 10 | 14.00 | 10 | 3 | 0 |
| 11 | 14.00 | 13 | 2 | 6 |
| 12 | 14.00 | 9 | 2 | 0 |
| 13 | 14.14 | 13 | 34 | 15 |
| 14 | 14.17 | 13 | 1 | 4 |
| 15 | 14.23 | 8 | 28 | 3 |
| 16 | 14.25 | 12 | 5 | 0 |
| 17 | 14.27 | 10 | 2 | 0 |
| 18 | 14.30 | 10 | 2 | 0 |
| 19 | 14.31 | 9 | 4 | 1 |
| 20 | 14.38 | 9 | 5 | 0 |
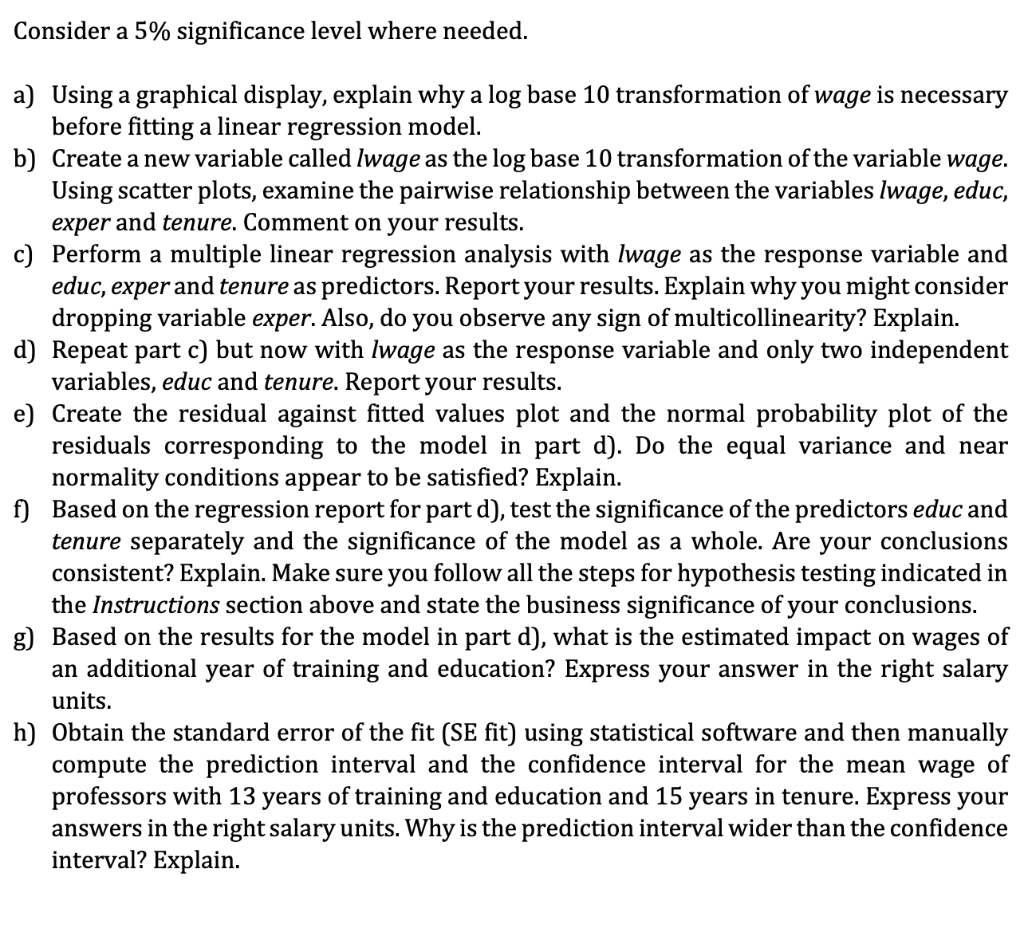
Question 2 - Wages of University Professors Your task will be to determine a regression model for estimating the impact of education, experience, and tenure on wages of university professors in Canada. The dataset Professor Wages provides information on 494 professors. It includes the following variables: . wage: educ: exper: tenure: annual salary in CAD $10000 number of years of training and education number of years teaching and doing research at university level number of years in tenure . Consider a 5% significance level where needed. a) Using a graphical display, explain why a log base 10 transformation of wage is necessary before fitting a linear regression model. b) Create a new variable called lwage as the log base 10 transformation of the variable wage. Using scatter plots, examine the pairwise relationship between the variables lwage, educ, exper and tenure. Comment on your results. c) Perform a multiple linear regression analysis with lwage as the response variable and educ, exper and tenure as predictors. Report your results. Explain why you might consider dropping variable exper. Also, do you observe any sign of multicollinearity? Explain. d) Repeat part c) but now with lwage as the response variable and only two independent variables, educ and tenure. Report your results. e) Create the residual against fitted values plot and the normal probability plot of the residuals corresponding to the model in part d). Do the equal variance and near normality conditions appear to be satisfied? Explain. f) Based on the regression report for part d), test the significance of the predictors educ and tenure separately and the significance of the model as a whole. Are your conclusions consistent? Explain. Make sure you follow all the steps for hypothesis testing indicated in the Instructions section above and state the business significance of your conclusions. g) Based on the results for the model in part d), what is the estimated impact on wages of an additional year of training and education? Express your answer in the right salary units. h) Obtain the standard error of the fit (SE fit) using statistical software and then manually compute the prediction interval and the confidence interval for the mean wage of professors with 13 years of training and education and 15 years in tenure. Express your answers in the right salary units. Why is the prediction interval wider than the confidence interval? Explain. Question 2 - Wages of University Professors Your task will be to determine a regression model for estimating the impact of education, experience, and tenure on wages of university professors in Canada. The dataset Professor Wages provides information on 494 professors. It includes the following variables: . wage: educ: exper: tenure: annual salary in CAD $10000 number of years of training and education number of years teaching and doing research at university level number of years in tenure . Consider a 5% significance level where needed. a) Using a graphical display, explain why a log base 10 transformation of wage is necessary before fitting a linear regression model. b) Create a new variable called lwage as the log base 10 transformation of the variable wage. Using scatter plots, examine the pairwise relationship between the variables lwage, educ, exper and tenure. Comment on your results. c) Perform a multiple linear regression analysis with lwage as the response variable and educ, exper and tenure as predictors. Report your results. Explain why you might consider dropping variable exper. Also, do you observe any sign of multicollinearity? Explain. d) Repeat part c) but now with lwage as the response variable and only two independent variables, educ and tenure. Report your results. e) Create the residual against fitted values plot and the normal probability plot of the residuals corresponding to the model in part d). Do the equal variance and near normality conditions appear to be satisfied? Explain. f) Based on the regression report for part d), test the significance of the predictors educ and tenure separately and the significance of the model as a whole. Are your conclusions consistent? Explain. Make sure you follow all the steps for hypothesis testing indicated in the Instructions section above and state the business significance of your conclusions. g) Based on the results for the model in part d), what is the estimated impact on wages of an additional year of training and education? Express your answer in the right salary units. h) Obtain the standard error of the fit (SE fit) using statistical software and then manually compute the prediction interval and the confidence interval for the mean wage of professors with 13 years of training and education and 15 years in tenure. Express your answers in the right salary units. Why is the prediction interval wider than the confidence interval? Explain


