

Question: please answer Figure 8.3 Aggregate supply and demand P P Price Level P. AD P AD 100 200 300 400 Real Output (billions of dollars

please answer
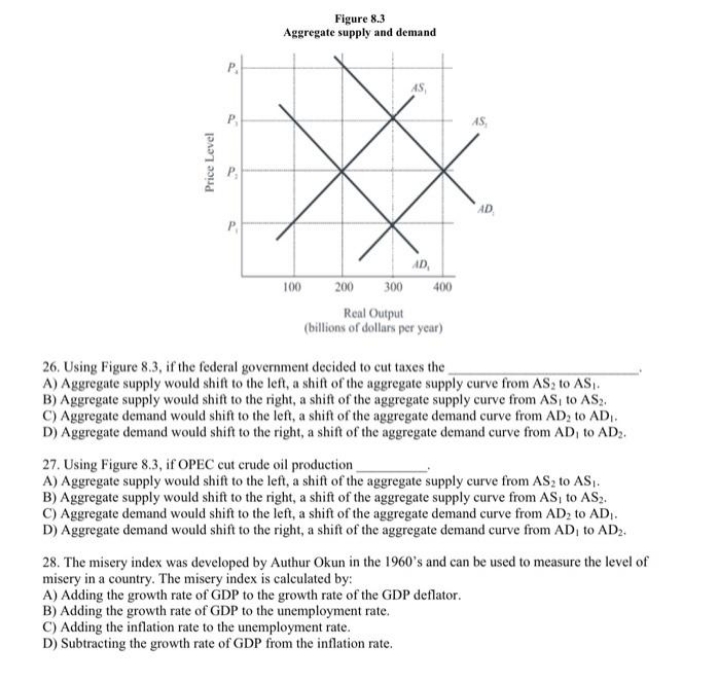
Figure 8.3 Aggregate supply and demand P P Price Level P. AD P AD 100 200 300 400 Real Output (billions of dollars per year) 26. Using Figure 8.3, if the federal government decided to cut taxes the A) Aggregate supply would shift to the left, a shift of the aggregate supply curve from AS, to AS. B) Aggregate supply would shift to the right, a shift of the aggregate supply curve from AS, to AS?. C) Aggregate demand would shift to the left, a shift of the aggregate demand curve from AD, to AD. D) Aggregate demand would shift to the right, a shift of the aggregate demand curve from AD, to ADz. 27. Using Figure 8.3, if OPEC cut crude oil production A) Aggregate supply would shift to the left, a shift of the aggregate supply curve from AS, to AS,. B) Aggregate supply would shift to the right, a shift of the aggregate supply curve from AS, to AS. C) Aggregate demand would shift to the left, a shift of the aggregate demand curve from AD, to AD. D) Aggregate demand would shift to the right, a shift of the aggregate demand curve from AD, to ADz. 28. The misery index was developed by Authur Okun in the 1960's and can be used to measure the level of misery in a country. The misery index is calculated by: A) Adding the growth rate of GDP to the growth rate of the GDP deflator. B) Adding the growth rate of GDP to the unemployment rate. C) Adding the inflation rate to the unemployment rate. D) Subtracting the growth rate of GDP from the inflation rate
Step by Step Solution
There are 3 Steps involved in it

Get step-by-step solutions from verified subject matter experts