

Question: Using data from the pie chart showing the distribution of income shares from the poorest to richest population quintiles for Namibia in 2012, construct a

Using data from the pie chart showing the distribution of income shares from the poorest to richest population quintiles for Namibia in 2012, construct a Lorenz curve on the gridlines below by connecting the points with straight lines. On the vertical axis indicate the associated cumulative income shares.
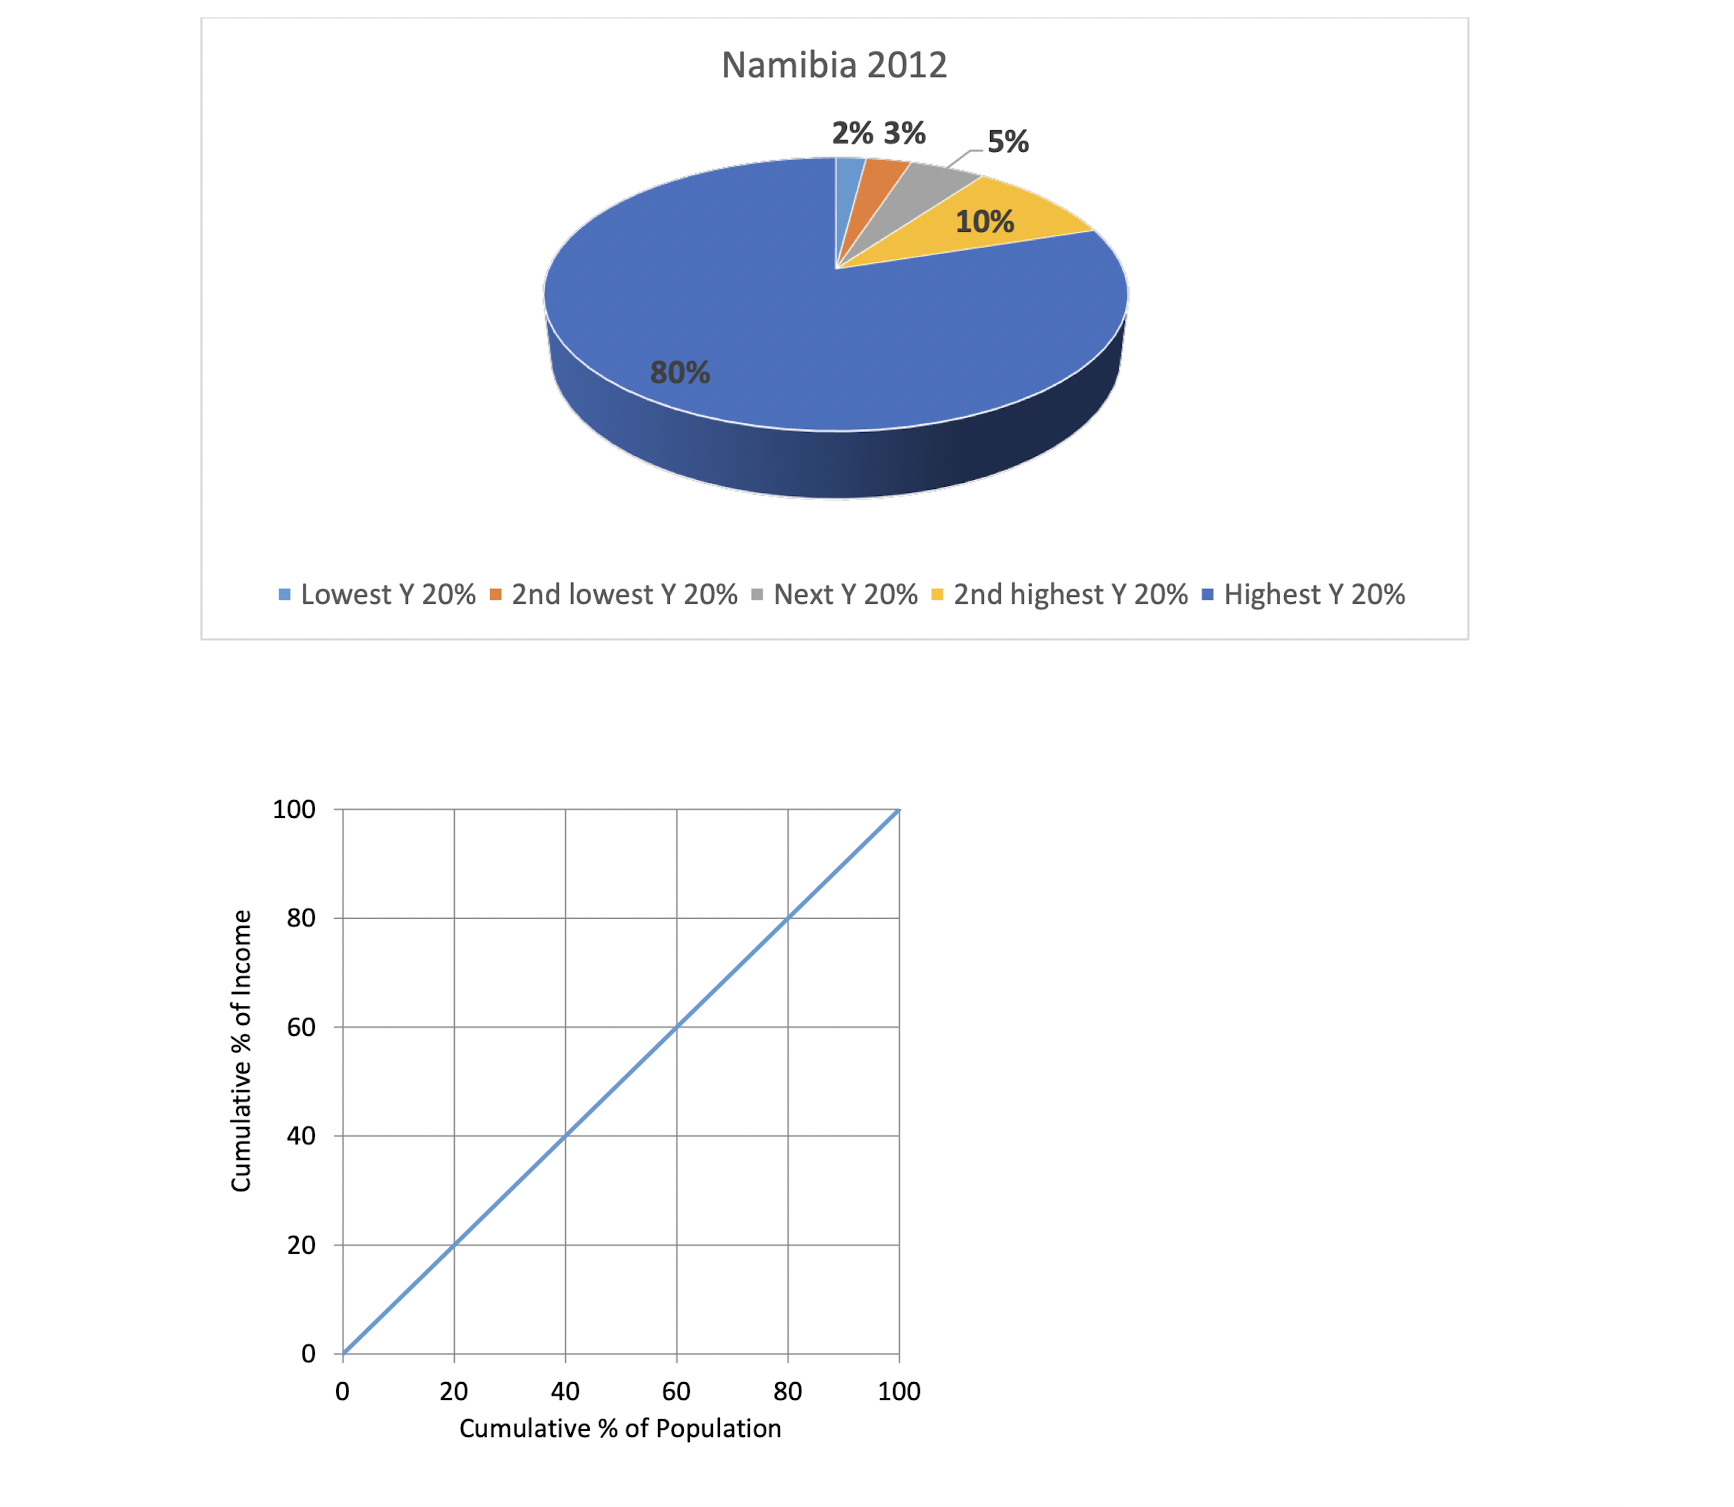
Namibia 2012 2% 3% 5% 10% 80% Lowest Y 20% = 2nd lowest Y 20% = Next Y 20% = 2nd highest Y 20% = Highest Y 20% 100 80 60 Cumulative % of Income 40 20 0 20 40 60 80 100 Cumulative % of Population
Step by Step Solution
There are 3 Steps involved in it
1 Expert Approved Answer
Step: 1 Unlock

Question Has Been Solved by an Expert!
Get step-by-step solutions from verified subject matter experts
Step: 2 Unlock
Step: 3 Unlock