

Question: Please answer first question, table provided to the right Refer to sheet 3: A furniture manufacturer has distribution centers in different regions of the country
Please answer first question, table provided to the right
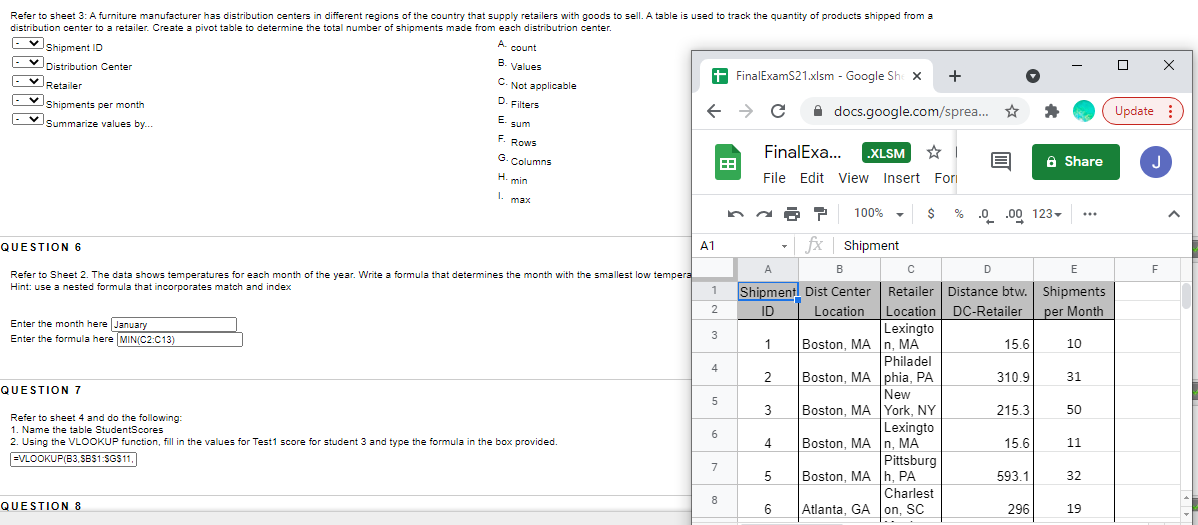
Refer to sheet 3: A furniture manufacturer has distribution centers in different regions of the country that supply retailers with goods to sell. A table is used to track the quantity of products shipped from a distribution center to a retailer. Create a pivot table to determine the total number of shipments made from each distribution center. Shipment ID A count Distribution Center B. Values + FinalExam 21.xlsm - Google Sh X + Retailer Shipments per month F c .docs.google.com/sprea... Summarize values by... C. Not applicable D. Filters Update : E sum F. Rows G. Columns FinalExa... .XLSM File Edit View Insert For Share J H. min 1. max QUESTION 6 A1 A F Refer to Sheet 2. The data shows temperatures for each month of the year. Write a formula that determines the month with the smallest low tempera Hint: use a nested formula that incorporates match and index 1 2 Enter the month here January Enter the formula here MIN(C2C13) 3 3 4 100% $ % . .00 123- - fx Shipment B D E Shipment Dist Center Retailer Distance btw. Shipments ID Location Location DC-Retailer per Month Lexingto 1 Boston, MA n, MA 15.6 10 Philadel 2 Boston, MA phia, PA 310.9 31 New 3 Boston, MA York, NY 215.3 50 Lexingto 4 Boston, MA |n, MA 15.6 11 Pittsburg 5 Boston, MA h, PA 593.1 32 Charlest 6 Atlanta, GA on, SC 296 19 QUESTION 7 5 6 Refer to sheet 4 and do the following: 1. Name the table Student Scores 2. Using the VLOOKUP function, fill in the values for Test1 score for student 3 and type the formula in the box provided. =VLOOKUP(B3, SB$1:$G$11, 7 8 8 QUESTION 8 Refer to sheet 3: A furniture manufacturer has distribution centers in different regions of the country that supply retailers with goods to sell. A table is used to track the quantity of products shipped from a distribution center to a retailer. Create a pivot table to determine the total number of shipments made from each distribution center. Shipment ID A count Distribution Center B. Values + FinalExam 21.xlsm - Google Sh X + Retailer Shipments per month F c .docs.google.com/sprea... Summarize values by... C. Not applicable D. Filters Update : E sum F. Rows G. Columns FinalExa... .XLSM File Edit View Insert For Share J H. min 1. max QUESTION 6 A1 A F Refer to Sheet 2. The data shows temperatures for each month of the year. Write a formula that determines the month with the smallest low tempera Hint: use a nested formula that incorporates match and index 1 2 Enter the month here January Enter the formula here MIN(C2C13) 3 3 4 100% $ % . .00 123- - fx Shipment B D E Shipment Dist Center Retailer Distance btw. Shipments ID Location Location DC-Retailer per Month Lexingto 1 Boston, MA n, MA 15.6 10 Philadel 2 Boston, MA phia, PA 310.9 31 New 3 Boston, MA York, NY 215.3 50 Lexingto 4 Boston, MA |n, MA 15.6 11 Pittsburg 5 Boston, MA h, PA 593.1 32 Charlest 6 Atlanta, GA on, SC 296 19 QUESTION 7 5 6 Refer to sheet 4 and do the following: 1. Name the table Student Scores 2. Using the VLOOKUP function, fill in the values for Test1 score for student 3 and type the formula in the box provided. =VLOOKUP(B3, SB$1:$G$11, 7 8 8 QUESTION 8Step by Step Solution
There are 3 Steps involved in it
1 Expert Approved Answer
Step: 1 Unlock

Question Has Been Solved by an Expert!
Get step-by-step solutions from verified subject matter experts
Step: 2 Unlock
Step: 3 Unlock