

Question: Please answer for a, b, c 1. A sample of 20 office workers was selected for a 6-week study investigating standing workstations. The study examined
Please answer for a, b, c
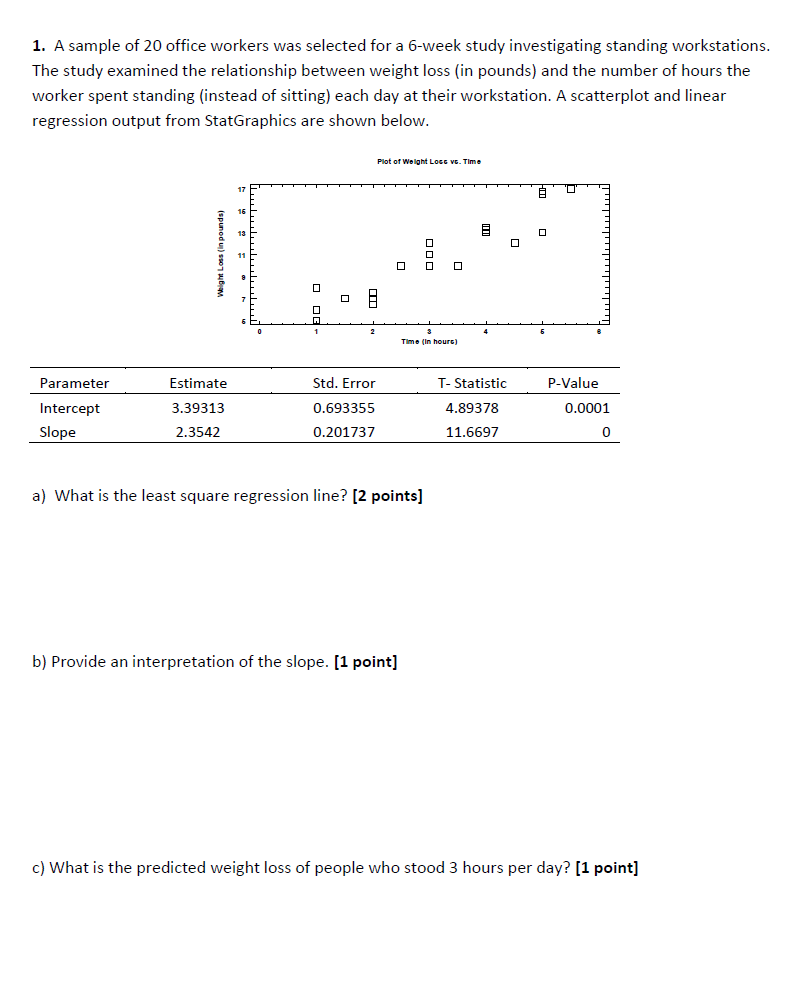
1. A sample of 20 office workers was selected for a 6-week study investigating standing workstations. The study examined the relationship between weight loss (in pounds) and the number of hours the worker spent standing (instead of sitting) each day at their workstation. A scatterplot and linear regression output from StatGraphics are shown below. Plot of Weight Loss vc. Time O Weight Loss ( In pounds) O 0 -30 0 Time (In hourc) Parameter Estimate Std. Error T- Statistic P-Value Intercept 3.39313 0.693355 4.89378 0.0001 Slope 2.3542 0.201737 11.6697 0 a) What is the least square regression line? [2 points] b) Provide an interpretation of the slope. [1 point] c) What is the predicted weight loss of people who stood 3 hours per day? [1 point]
Step by Step Solution
There are 3 Steps involved in it

Get step-by-step solutions from verified subject matter experts