

Question: please answer for blanks, will give good rating if answer is correct The following table shows the actual demand observed over the last 11 years:
please answer for blanks, will give good rating if answer is correct
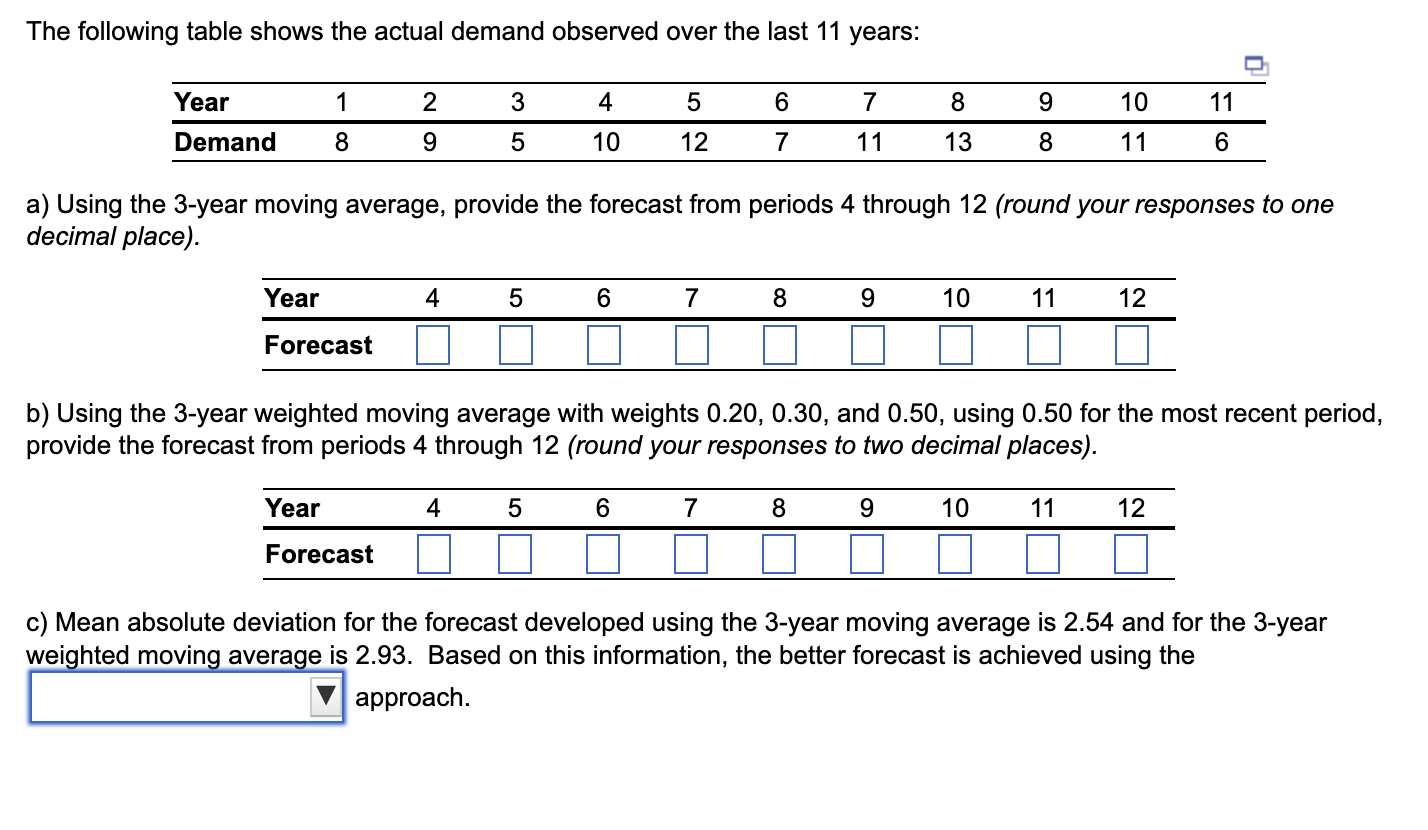
The following table shows the actual demand observed over the last 11 years: a) Using the 3-year moving average, provide the forecast from periods 4 through 12 (round your responses to one decimal place). b) Using the 3-year weighted moving average with weights 0.20,0.30, and 0.50 , using 0.50 for the most recent perio provide the forecast from periods 4 through 12 (round your responses to two decimal places). c) Mean absolute deviation for the forecast developed using the 3-year moving average is 2.54 and for the 3-year weighted moving average is 2.93 . Based on this information, the better forecast is achieved using the approach
Step by Step Solution
There are 3 Steps involved in it

Get step-by-step solutions from verified subject matter experts