

Question: PLEASE ANSWER FOR YEARS 2005-2010 begin{tabular}{llcc} multicolumn{5}{l}{} & Ideko's Working Capital Requirements & & hline Working Capital Days & & 2005 & >2005
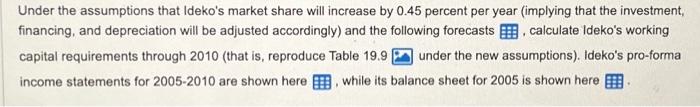
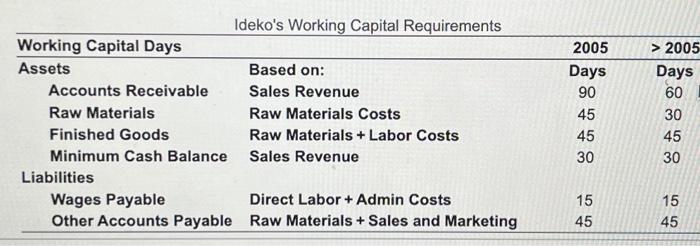
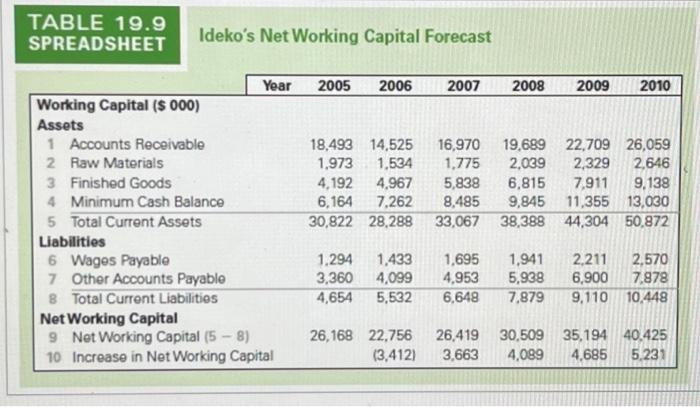
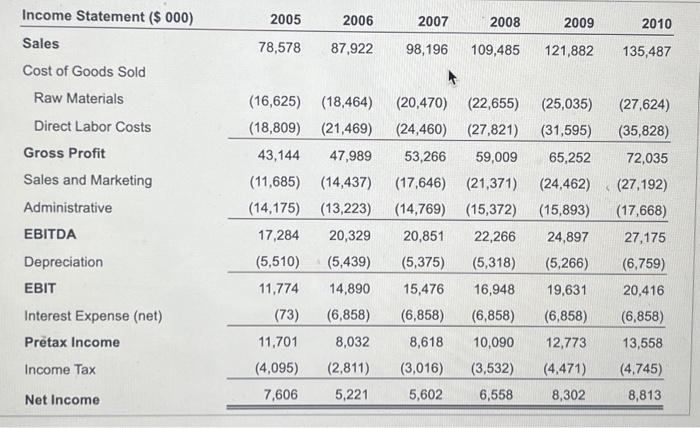
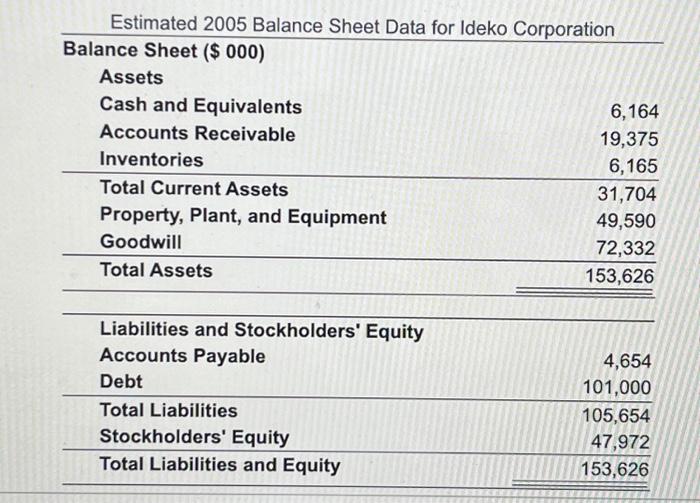
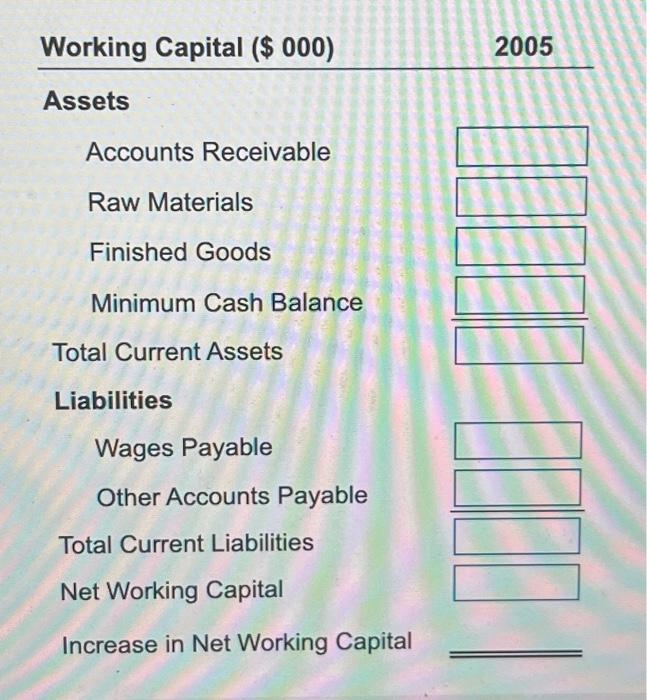
\begin{tabular}{llcc} \multicolumn{5}{l}{} & Ideko's Working Capital Requirements & & \\ \hline Working Capital Days & & 2005 & >2005 \\ \hline Assets & Based on: & Days & Days \\ Accounts Receivable & Sales Revenue & 90 & 60 \\ Raw Materials & Raw Materials Costs & 45 & 30 \\ Finished Goods & Raw Materials + Labor Costs & 45 & 45 \\ Minimum Cash Balance & Sales Revenue & 30 & 30 \\ Liabilities & & & \\ Wages Payable & Direct Labor + Admin Costs & 15 & 15 \\ Other Accounts Payable & Raw Materials + Sales and Marketing & 45 & 45 \\ \hline \end{tabular} Estimated 2005 Balance Sheet Data for Ideko Corporation Balance Sheet (\$000) Assets Cash and Equivalents Accounts Receivable 6,164 Inventories 19,375 Total Current Assets 6,165 Property, Plant, and Equipment 49,590 Goodwill 72,332 Total Assets 72,332153,626 Liabilities and Stockholders' Equity Accounts Payable 4,654 Debt 101,000 Total Liabilities Stockholders' Equity 105,654 Total Liabilities and Equity 47,972 153,626 \begin{tabular}{l} Working Capital ($000) \\ \hline Assets \\ Accounts Receivable \\ Raw Materials \\ Finished Goods \\ Minimum Cash Balance \\ Total Current Assets \\ Liabilities \\ Wages Payable \\ Other Accounts Payable \\ Total Current Liabilities \\ Net Working Capital \\ Increase in Net Working Capital \end{tabular} Ideko's Net Working Capital Forecast Under the assumptions that Ideko's market share will increase by 0.45 percent per year (implying that the investment, financing, and depreciation will be adjusted accordingly) and the following forecasts , calculate Ideko's working capital requirements through 2010 (that is, reproduce Table 19.9 under the new assumptions). Ideko's pro-forma income statements for 2005-2010 are shown here , while its balance sheet for 2005 is shown here \begin{tabular}{lrrrrrr} Income Statement ($000) & 2005 & 2006 & 2007 & 2008 & 2009 & 2010 \\ \hline Sales & 78,578 & 87,922 & 98,196 & 109,485 & 121,882 & 135,487 \\ Cost of Goods Sold & & & & & & \\ Raw Materials & (16,625) & (18,464) & (20,470) & (22,655) & (25,035) & (27,624) \\ Direct Labor Costs & (18,809) & (21,469) & (24,460) & (27,821) & (31,595) & (35,828) \\ \cline { 2 - 8 } Gross Profit & 43,144 & 47,989 & 53,266 & 59,009 & 65,252 & 72,035 \\ Sales and Marketing & (11,685) & (14,437) & (17,646) & (21,371) & (24,462) & (27,192) \\ Administrative & (14,175) & (13,223) & (14,769) & (15,372) & (15,893) & (17,668) \\ EBITDA & 17,284 & 20,329 & 20,851 & 22,266 & 24,897 & 27,175 \\ Depreciation & (5,510) & (5,439) & (5,375) & (5,318) & (5,266) & (6,759) \\ EBIT & 11,774 & 14,890 & 15,476 & 16,948 & 19,631 & 20,416 \\ Interest Expense (net) & (73) & (6,858) & (6,858) & (6,858) & (6,858) & (6,858) \\ Prtax Income & 11,701 & 8,032 & 8,618 & 10,090 & 12,773 & 13,558 \\ Income Tax & (4,095) & (2,811) & (3,016) & (3,532) & (4,471) & (4,745) \\ Net Income & 7,606 & 5,221 & 5,602 & 6,558 & 8,302 & 8,813 \\ \hline \hline \end{tabular}
Step by Step Solution
There are 3 Steps involved in it

Get step-by-step solutions from verified subject matter experts