

Question: PLEASE ANSWER I REALLY NEED HELP Graph the value of your portfolio as a function of the relevant stock price. Show ALL your work and
PLEASE ANSWER I REALLY NEED HELP Graph the value of your portfolio as a function of the relevant stock price. Show ALL your work and use EXCEL for graphs (please display the formulas used once you're done) For each graph, graph for stock prices between 50 and 80 with 50 data points ( Ex 50.5, 51, 51.5, 52 etc). Assume today is the last day for exercising your options.
1. You own (are long) a call with an exercise price of 70 and a put at 65. EXAMPLE ON WHAT IT SHOULD LOOK LIKE WHEN COMPLETED 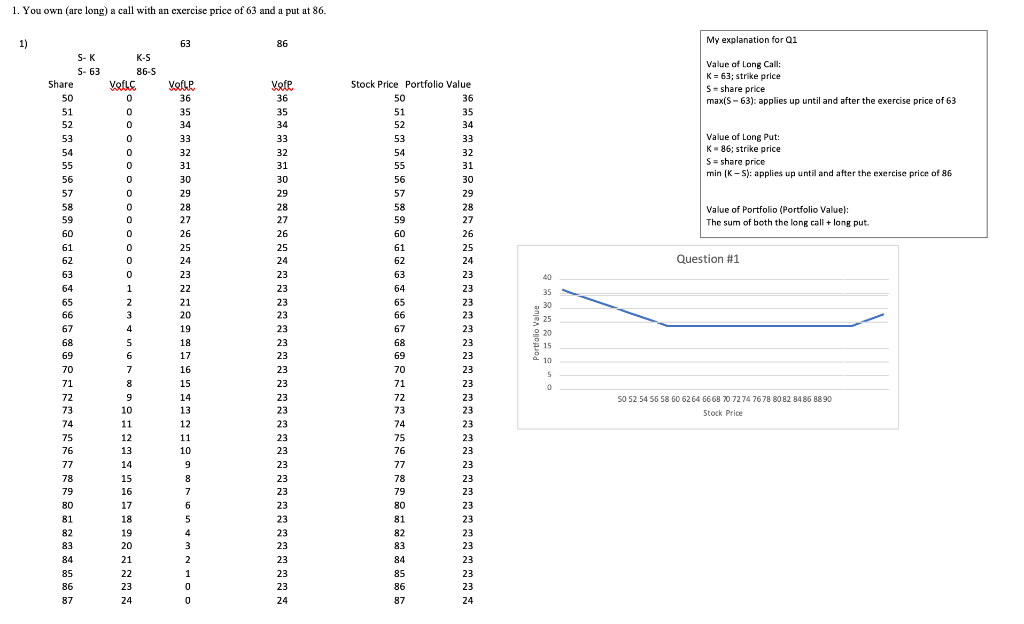
1. You own (are long) a call with an exercise price of 63 and a put at 86. 1) 63 86 My explanation for Q1 K-S 86-5 Vatic 0 0 0 Value of Long Call: K = 63; strike price S = share price max(S-63): applies up until and after the exercise price of 63 Vete 36 35 34 33 32 31 30 0 0 Value of Long Put: K-86: strike price S = share price min (K-5): applies up until and after the exercise price of 86 0 0 0 0 0 Value of Portfolio (Portfolio Value): The sum of both the long call + long put. 0 0 0 0 Question #1 S-K S-63 Share 50 51 52 53 54 55 56 57 58 59 60 61 62 63 64 65 66 67 68 69 70 71 72 73 74 75 76 77 78 79 80 81 82 83 84 85 86 87 Vofle 36 35 34 33 32 31 30 29 28 27 26 25 24 23 22 21 20 19 18 17 16 15 14 13 12 11 10 40 35 30 25 20 15 10 Stock Price Portfolio Value 50 36 51 35 52 34 53 33 54 32 55 31 56 30 57 29 58 28 59 27 60 26 61 25 62 24 63 23 64 23 65 23 66 23 67 23 68 23 69 23 70 23 71 23 72 23 73 23 74 23 75 23 76 23 77 23 78 23 79 23 80 23 81 23 82 23 83 23 84 23 85 23 86 23 87 24 5 0 29 28 27 26 25 24 23 23 23 23 23 23 23 23 23 23 23 23 23 23 23 23 23 23 23 23 23 23 23 23 24 1 2 3 4 5 6 6 7 8 9 10 11 12 13 14 15 16 17 18 19 20 21 22 23 24 50 52 54 56 58 60 62 64 66 68 70 72 74 76 78 80 82 84 86 88 90 Stock Price 9 8 7 6 5 4 3 2 1 0 0 0
Step by Step Solution
There are 3 Steps involved in it

Get step-by-step solutions from verified subject matter experts