

Question: PLEASE ANSWER IN PYTHON a sample from the referenced file, numpy_wine.csv, is included below Download 'numpy_wine.csv' as source file, each row in the data file
PLEASE ANSWER IN PYTHON
a sample from the referenced file, "numpy_wine.csv", is included below
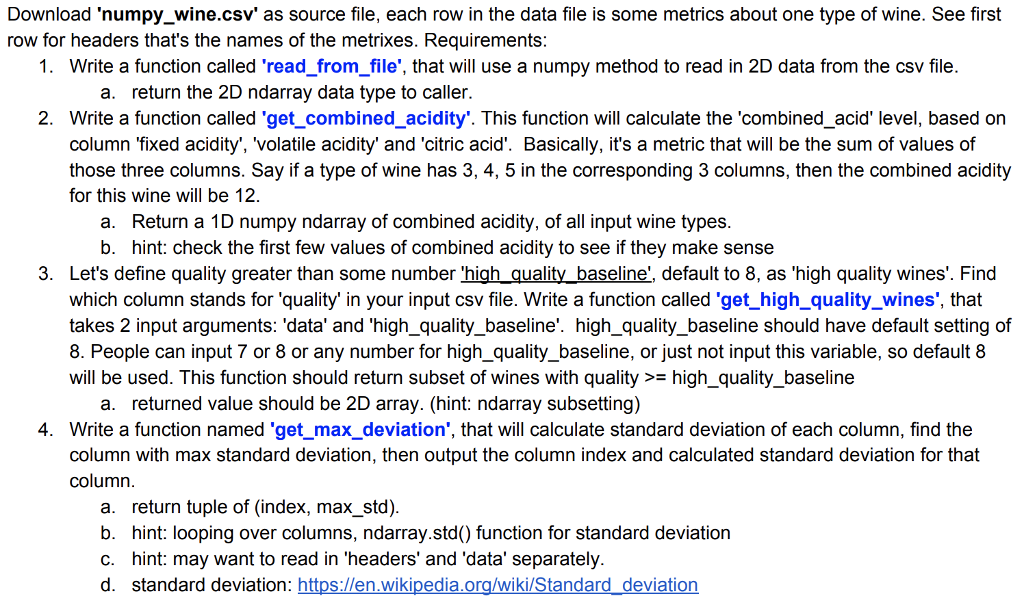
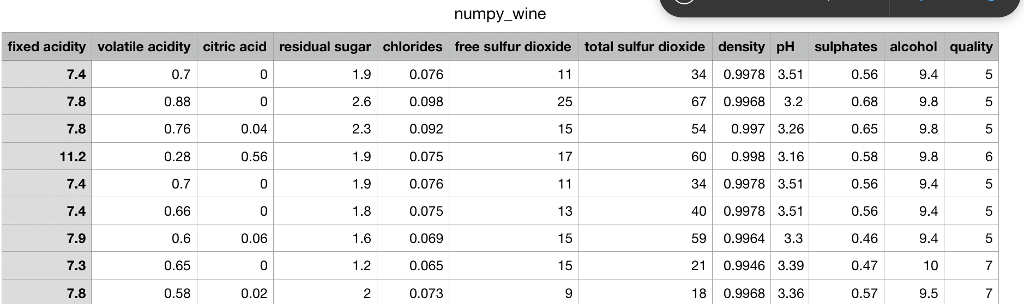
Download 'numpy_wine.csv' as source file, each row in the data file is some metrics about one type of wine. See first row for headers that's the names of the metrixes. Requirements: 1. Write a function called 'read_from_file', that will use a numpy method to read in 2D data from the csv file a. return the 2D ndarray data type to caller 2. Write a function called 'get_combined_acidity'. This function will calculate the 'combined_acid' level, based on column 'fixed acidity', 'volatile acidity' and 'citric acid'. Basically, it's a metric that will be the sum of values of those three columns. Say if a type of wine has 3, 4, 5 in the corresponding 3 columns, then the combined acidity for this wine will be 12. a. Return a 1D numpy ndarray of combined acidity, of all input wine types b. hint: check the first few values of combined acidity to see if they make sense 3. Let's define quality greater than some number 'high_quality_baseline, default to 8, as 'high quality wines'. Find which column stands for 'quality' in your input csv file. Write a function called 'get_high_quality wines', that takes 2 input arguments: 'data' and 'high_quality_baseline'. high_quality_baseline should have default setting of 8. People can input 7 or 8 or any number for high_quality_baseline, or just not input this variable, so default 8 will be used. This function should return subset of wines with quality> high_quality_baseline a. returned value should be 2D array. (hint: ndarray subsetting) Write a function named 'get_max_deviation', that will calculate standard deviation of each column, find the column with max standard deviation, then output the column index and calculated standard deviation for that column 4. TiF. a. return tuple of (index, max_std). b. hint: looping over columns, ndarray.std() function for standard deviation c. hint: may want to read in 'headers' and 'data' separately. d. standard deviation: https://en wikipedia.org/wikilStandard_deviation Download 'numpy_wine.csv' as source file, each row in the data file is some metrics about one type of wine. See first row for headers that's the names of the metrixes. Requirements: 1. Write a function called 'read_from_file', that will use a numpy method to read in 2D data from the csv file a. return the 2D ndarray data type to caller 2. Write a function called 'get_combined_acidity'. This function will calculate the 'combined_acid' level, based on column 'fixed acidity', 'volatile acidity' and 'citric acid'. Basically, it's a metric that will be the sum of values of those three columns. Say if a type of wine has 3, 4, 5 in the corresponding 3 columns, then the combined acidity for this wine will be 12. a. Return a 1D numpy ndarray of combined acidity, of all input wine types b. hint: check the first few values of combined acidity to see if they make sense 3. Let's define quality greater than some number 'high_quality_baseline, default to 8, as 'high quality wines'. Find which column stands for 'quality' in your input csv file. Write a function called 'get_high_quality wines', that takes 2 input arguments: 'data' and 'high_quality_baseline'. high_quality_baseline should have default setting of 8. People can input 7 or 8 or any number for high_quality_baseline, or just not input this variable, so default 8 will be used. This function should return subset of wines with quality> high_quality_baseline a. returned value should be 2D array. (hint: ndarray subsetting) Write a function named 'get_max_deviation', that will calculate standard deviation of each column, find the column with max standard deviation, then output the column index and calculated standard deviation for that column 4. TiF. a. return tuple of (index, max_std). b. hint: looping over columns, ndarray.std() function for standard deviation c. hint: may want to read in 'headers' and 'data' separately. d. standard deviation: https://en wikipedia.org/wikilStandard_deviation
Step by Step Solution
There are 3 Steps involved in it

Get step-by-step solutions from verified subject matter experts