

Question: #Please Answer in python Codeblock #2 Examining the Data A) To start, check the stationarity of the data by plotting the rolling mean and standard
#Please Answer in python Codeblock
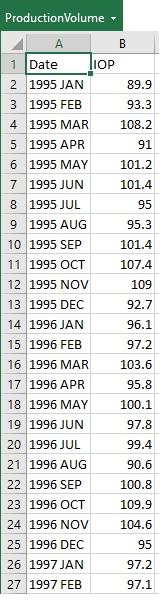
#2 Examining the Data
A)
To start, check the stationarity of the data by plotting the rolling mean and standard deviation alongside the data itself.
Based on your plot, is the data stationary? Provide reasons with your answes. Include your answer either as a text cell or in-line comment.
B)
Use seasonal_decompose to observe the trend, seasonality, and residuals for the data by plotting all plots alongside one another.
Based on your plots, is there a cyclical pattern in the data? Provide reasons with your answers. Include your answer either as a text cell or in-line comment.
C)
To further confirm stationarity or non-stationarity, perform the Dickey-Fuller Test on the data. You may use the run_adftest method provided in lecture (below).
from statsmodels.tsa.stattools import adfuller
def run_adftest(s): print("Dickey-Fuller Test") adftest = adfuller(s, autolag='AIC') print(f"Test Statistic: {adftest[0]}") print(f"p-value: {adftest[1]}") print("Critical Values:") for k, v in adftest[4].items(): print("\t{}: {} - The data is{} stationary with {}% confidence".format(k, v, " not" if v run_adftest(series['IOP']) **IOP can be replaces with series of interest Based on the result, is any differencing needed? If so, first-order difference the data and re-run the Dickey-Fuller Test to see if the results change.
Step by Step Solution
There are 3 Steps involved in it

Get step-by-step solutions from verified subject matter experts