

Question: Problem 2: Assume the SAT scores follows normal distribution with a mean of 1150 and standard deviation of 150. (1) Plot the probability density
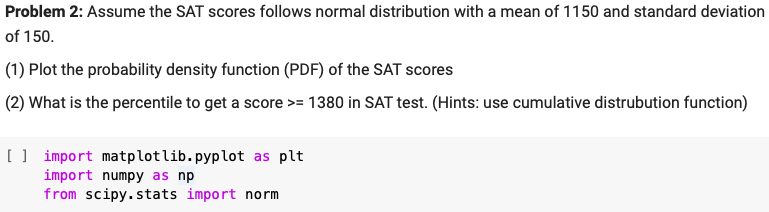
Problem 2: Assume the SAT scores follows normal distribution with a mean of 1150 and standard deviation of 150. (1) Plot the probability density function (PDF) of the SAT scores (2) What is the percentile to get a score >= 1380 in SAT test. (Hints: use cumulative distrubution function) [] import matplotlib.pyplot as plt import numpy as np from scipy.stats import norm
Step by Step Solution
★★★★★
3.39 Rating (161 Votes )
There are 3 Steps involved in it
1 Expert Approved Answer
Step: 1 Unlock

Question Has Been Solved by an Expert!
Get step-by-step solutions from verified subject matter experts
Step: 2 Unlock
Step: 3 Unlock