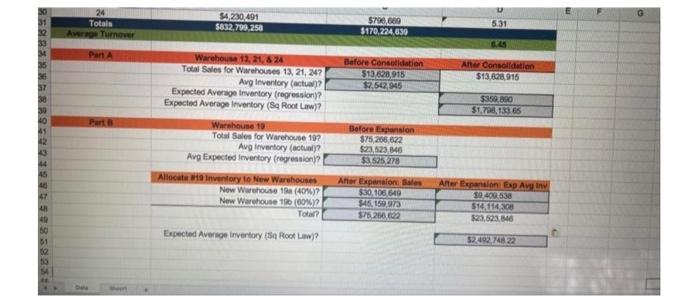
Question: please answer is it visible now? Totals Average Turnover Part A Part B $4,230,491 $832,799,258 Warehouse 13, 21, & 24 Total Sales for Warehouses 13,
please answer
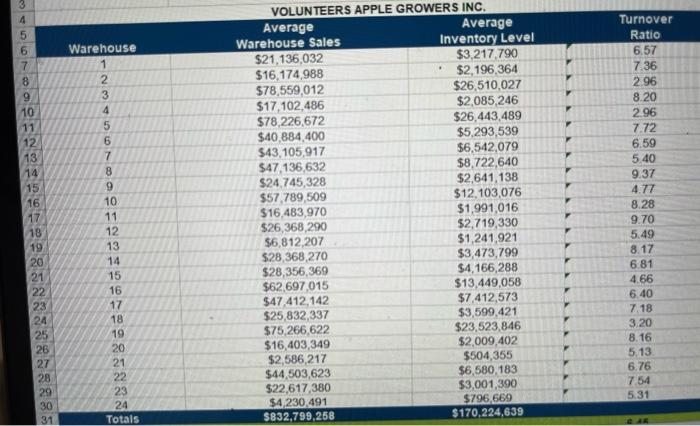
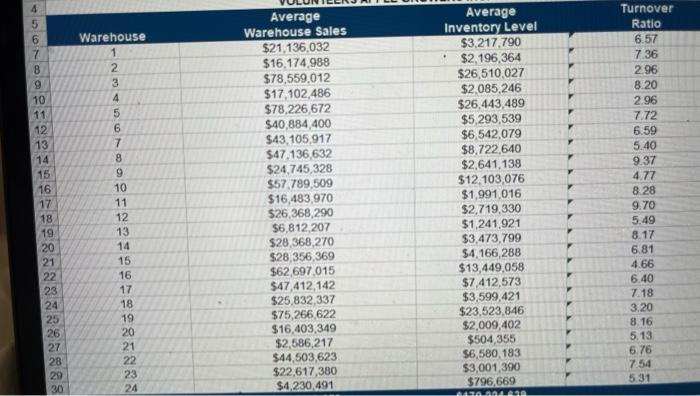
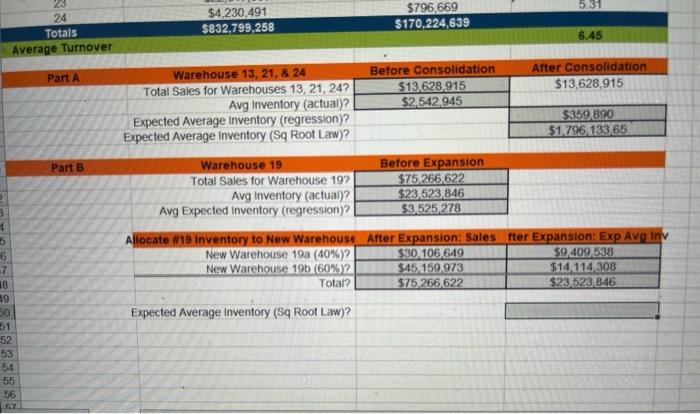
Totals Average Turnover Part A Part B $4,230,491 $832,799,258 Warehouse 13, 21, & 24 Total Sales for Warehouses 13, 21, 247 Avg Inventory (actual)? Expected Average Inventory (regression)? Expected Average Inventory (Sq Root Law)? Warehouse 19 Total Sales for Warehouse 197 Avg Inventory (actual)? Avg Expected Inventory (regression)? Allocate #19 Inventory to New Warehouses New Warehouse 19a (40%)? New Warehouse 196 (60 %)? Total? Expected Average Inventory (Sq Root Law)? $790,669 $170,224,639 Before Consolidation $13,628,915 $2,542,945 Before Expansion $75,266,622 $23.523.846 $3.525.278 After Expansion Sales $30,106,649 $45, 150 973 $75.266.622 5.31 6.45 After Consolidation $13,628,915 $359.800 $1,798,133.65 After Expansion Exp Avg Inv $9.400.538 $14,114,308 $23,523.846 $2,492,748 22 3 4 5 6 8 9 10 11 12 13 14 15 16 17 18 19 20 21 22 23 24 25 26 27 28 29 30 31 Warehouse 1 2 3 4 5 6 7 COFFRPPPPANNANE 8 9 10 11 12 13 14 15 16 17 18 19 20 21 22 23 24 Totals VOLUNTEERS APPLE GROWERS INC. Average Warehouse Sales $21,136,032 $16,174,988 $78,559,012 $17,102,486 $78,226,672 $40,884,400 $43,105,917 $47,136,632 $24,745,328 $57,789,509 $16,483,970 $26,368,290 $6,812,207 $28,368,270 $28,356,369 $62,697,015 $47,412,142 $25,832,337 $75,266,622 $16,403,349 $2,586,217 $44,503,623 $22,617,380 $4,230,491 $832,799,258 Average Inventory Level $3,217,790 $2,196,364 $26,510,027 $2,085,246 $26,443,489 $5,293,539 . $6,542,079 $8,722,640 $2,641,138 $12,103,076 $1,991,016 $2,719,330 $1,241,921 $3,473,799 $4,166,288 $13,449,058 $7,412,573 $3,599,421 $23,523,846 $2,009,402 $504,355 $6,580,183 $3,001,390 $796,669 $170,224,639 Turnover Ratio 6.57 7.36 2.96 8.20 2.96 7.72 6.59 5.40 9.37 4.77 8.28 9.70 5.49 8.17 6.81 4.66 6.40 7.18 3.20 8.16 5.13 6.76 7.54 5.31 4. (15 points) Based on your calculations in Part B, answer the following questions: a. Are the calculations for the expected average inventory levels for 19a and 19b what you would expect? Why or why not? b. How does the total expected inventory level of the 2-warehouse system compare with the baseline for Warehouse 19 (before decentralization)? What might account for the difference? c. How does the total expected inventory level of the 2-warehouse system compare with the Square Root Law calculation? What might account for the difference? d. How does a decentralized network with more warehouses impact both customer service and inventory carrying costs for the supply chain? 5. (5 points) What are the advantages and disadvantages of using the square root heuristic compared to using actual data? 4 5 6 7 8 9 10 11 12 13 14 15 16 17 18. 19 20 21 22 23 24 25 26 27 28 29 30 Warehouse 1 2 3 4 5 6 7 8 9 10 11 12 13 BH5671810 2012 23 24 14 19 Average Warehouse Sales $21,136,032 $16,174,988 $78,559,012 $17,102,486 $78,226,672 $40,884,400 $43,105,917 $47,136,632 $24,745,328 $57,789,509 $16,483,970 $26,368,290 $6,812,207 $28,368,270 $28,356,369 $62,697,015 $47,412,142 $25,832,337 $75,266,622 $16,403,349 $2,586,217 $44,503,623 $22,617,380 $4,230,491 Average Inventory Level $3,217,790 $2,196,364 . $26,510,027 $2,085,246 $26,443,489 $5,293,539 $6,542,079 $8,722,640 $2,641,138 $12,103,076 $1,991,016 $2,719,330 $1,241,921 $3,473,799 $4,166,288 $13,449,058 $7,412,573 $3,599,421 $23,523,846 $2,009,402 $504,355 $6,580,183 $3,001,390 $796,669 6470.904.839 Turnover Ratio 6.57 7.36 2.96 8.20 2.96 7.72 6.59 5.40 9.37 4.77 8.28 9.70 5.49 8.17 6.81 4.66 6.40 7.18 3.20 8.16 5.13 6.76 7.54 5.31 2. 3 1 5 6 23 24 Totals Average Turnover 7 18 19 50 51 52 53 54 55 56 67 Part A Part B $4,230,491 $832,799,258 Warehouse 13, 21, & 24 Total Sales for Warehouses 13, 21, 24? Avg Inventory (actual)? Expected Average Inventory (regression)? Expected Average Inventory (Sq Root Law)? Warehouse 19 Total Sales for Warehouse 197 Avg Inventory (actual)? Avg Expected Inventory (regression)? Allocate #19 Inventory to New Warehouse New Warehouse 19a (40 %)? New Warehouse 19b (60%) 2 Total? Expected Average Inventory (Sq Root Law)? $796,669 $170,224,639 Before Consolidation $13,628,915 $2,542,945 Before Expansion $75,266,622 $23,523,846 $3.525.278 5.31 6.45 After Consolidation $13,628,915 $359,890 $1,796,133,65 After Expansion: Sales fter Expansion: Exp Avg Inv $30,106,649 $45,159,973 $75,266,622 $9.409,538 $14.114,308 $23,523,846 4. (15 points) Based on your calculations in Part B, answer the following questions: a. Are the calculations for the expected average inventory levels for 19a and 19b what you would expect? Why or why not? b. How does the total expected inventory level of the 2-warehouse system compare with the baseline for Warehouse 19 (before decentralization)? What might account for the difference? c. How does the total expected inventory level of the 2-warehouse system compare with the Square Root Law calculation? What might account for the difference? d. How does a decentralized network with more warehouses impact both customer service and inventory carrying costs for the supply chain? 5. (5 points) What are the advantages and disadvantages of using the square root heuristic compared to using actual data