

Question: Please answer it for social sciences. Part I. Consider the table below, the frequency histogram, and the percentiles given in the latter table. Class Interval
Please answer it for social sciences.
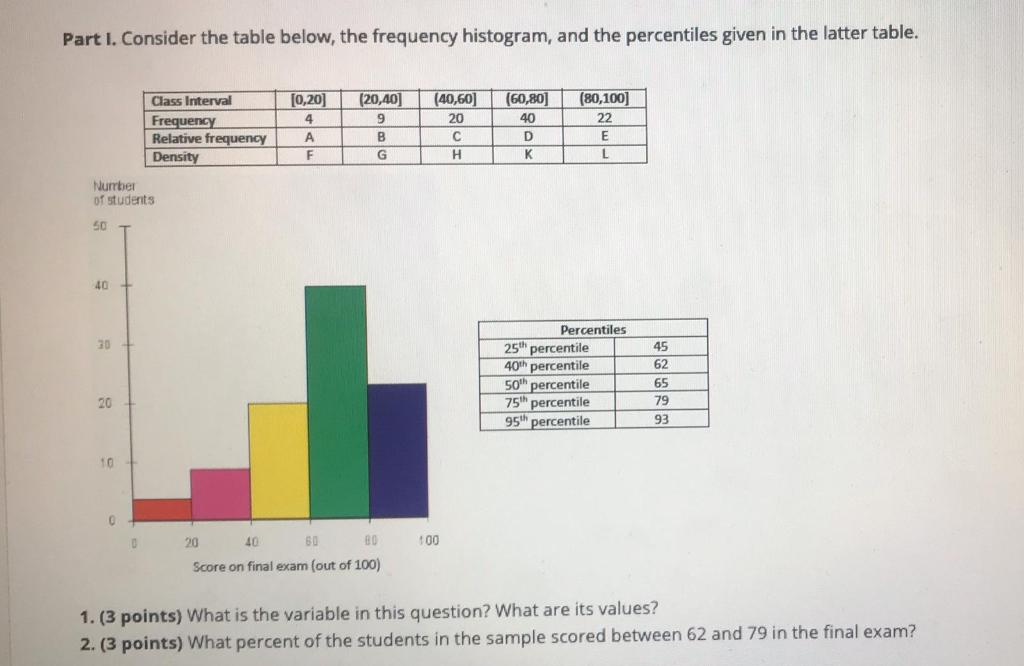
Part I. Consider the table below, the frequency histogram, and the percentiles given in the latter table. Class Interval Frequency Relative frequency Density [0,20] 4 A F (20,40] 9 B G (40,60] 20 H (60,80] 40 D K (80,100] 22 E L Nurrber of students 50 40 Percentiles 25th percentile 40th percentile 50 percentile 75 percentile 95 percentile 45 62 65 79 20 93 10 0 0 100 20 40 BO 0 Score on final exam (out of 100) 1.(3 points) What is the variable in this question? What are its values? 2. (3 points) What percent of the students in the sample scored between 62 and 79 in the final examStep by Step Solution
There are 3 Steps involved in it
1 Expert Approved Answer
Step: 1 Unlock

Question Has Been Solved by an Expert!
Get step-by-step solutions from verified subject matter experts
Step: 2 Unlock
Step: 3 Unlock