

Question: Please answer multiple choice and show work Given the graph below, use 5 rectangles to estimate the area under the graph from x = 0
Please answer multiple choice and show work
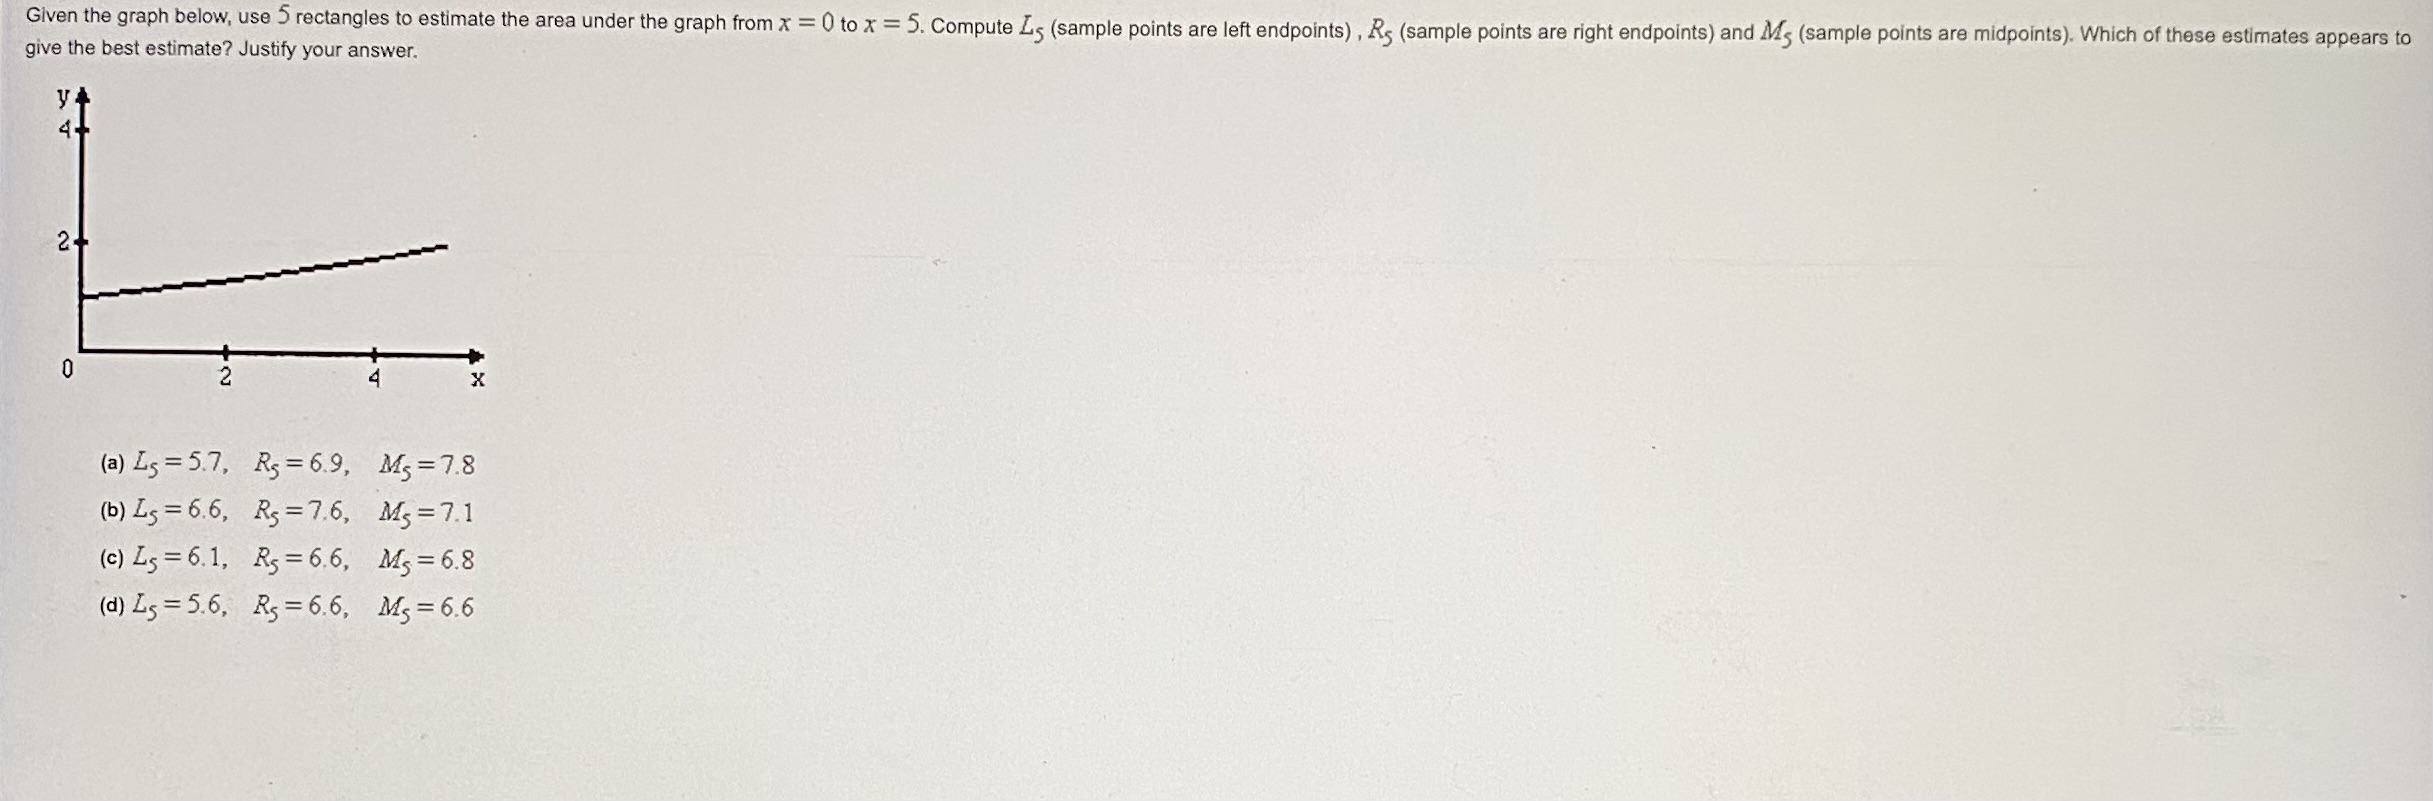
Given the graph below, use 5 rectangles to estimate the area under the graph from x = 0 to x = 5. Compute Ls (sample points are left endpoints) , Rs (sample points are right endpoints) and Mis (sample points are midpoints). Which of these estimates appears to give the best estimate? Justify your answer. y + X (a) Ls = 5.7, Rs = 6.9, Ms =7.8 (b) Ls = 6.6, Rs = 7.6, MS = 7.1 (c) Ls = 6.1, Rs = 6.6, MS = 6.8 (d) Ls = 5.6, Rs = 6.6, MS = 6.6
Step by Step Solution
There are 3 Steps involved in it
1 Expert Approved Answer
Step: 1 Unlock

Question Has Been Solved by an Expert!
Get step-by-step solutions from verified subject matter experts
Step: 2 Unlock
Step: 3 Unlock