

Question: Please answer multiple choice and show work Question 15: (1 point) Given the graph below, use 10 rectangles to estimate the area under the graph
Please answer multiple choice and show work
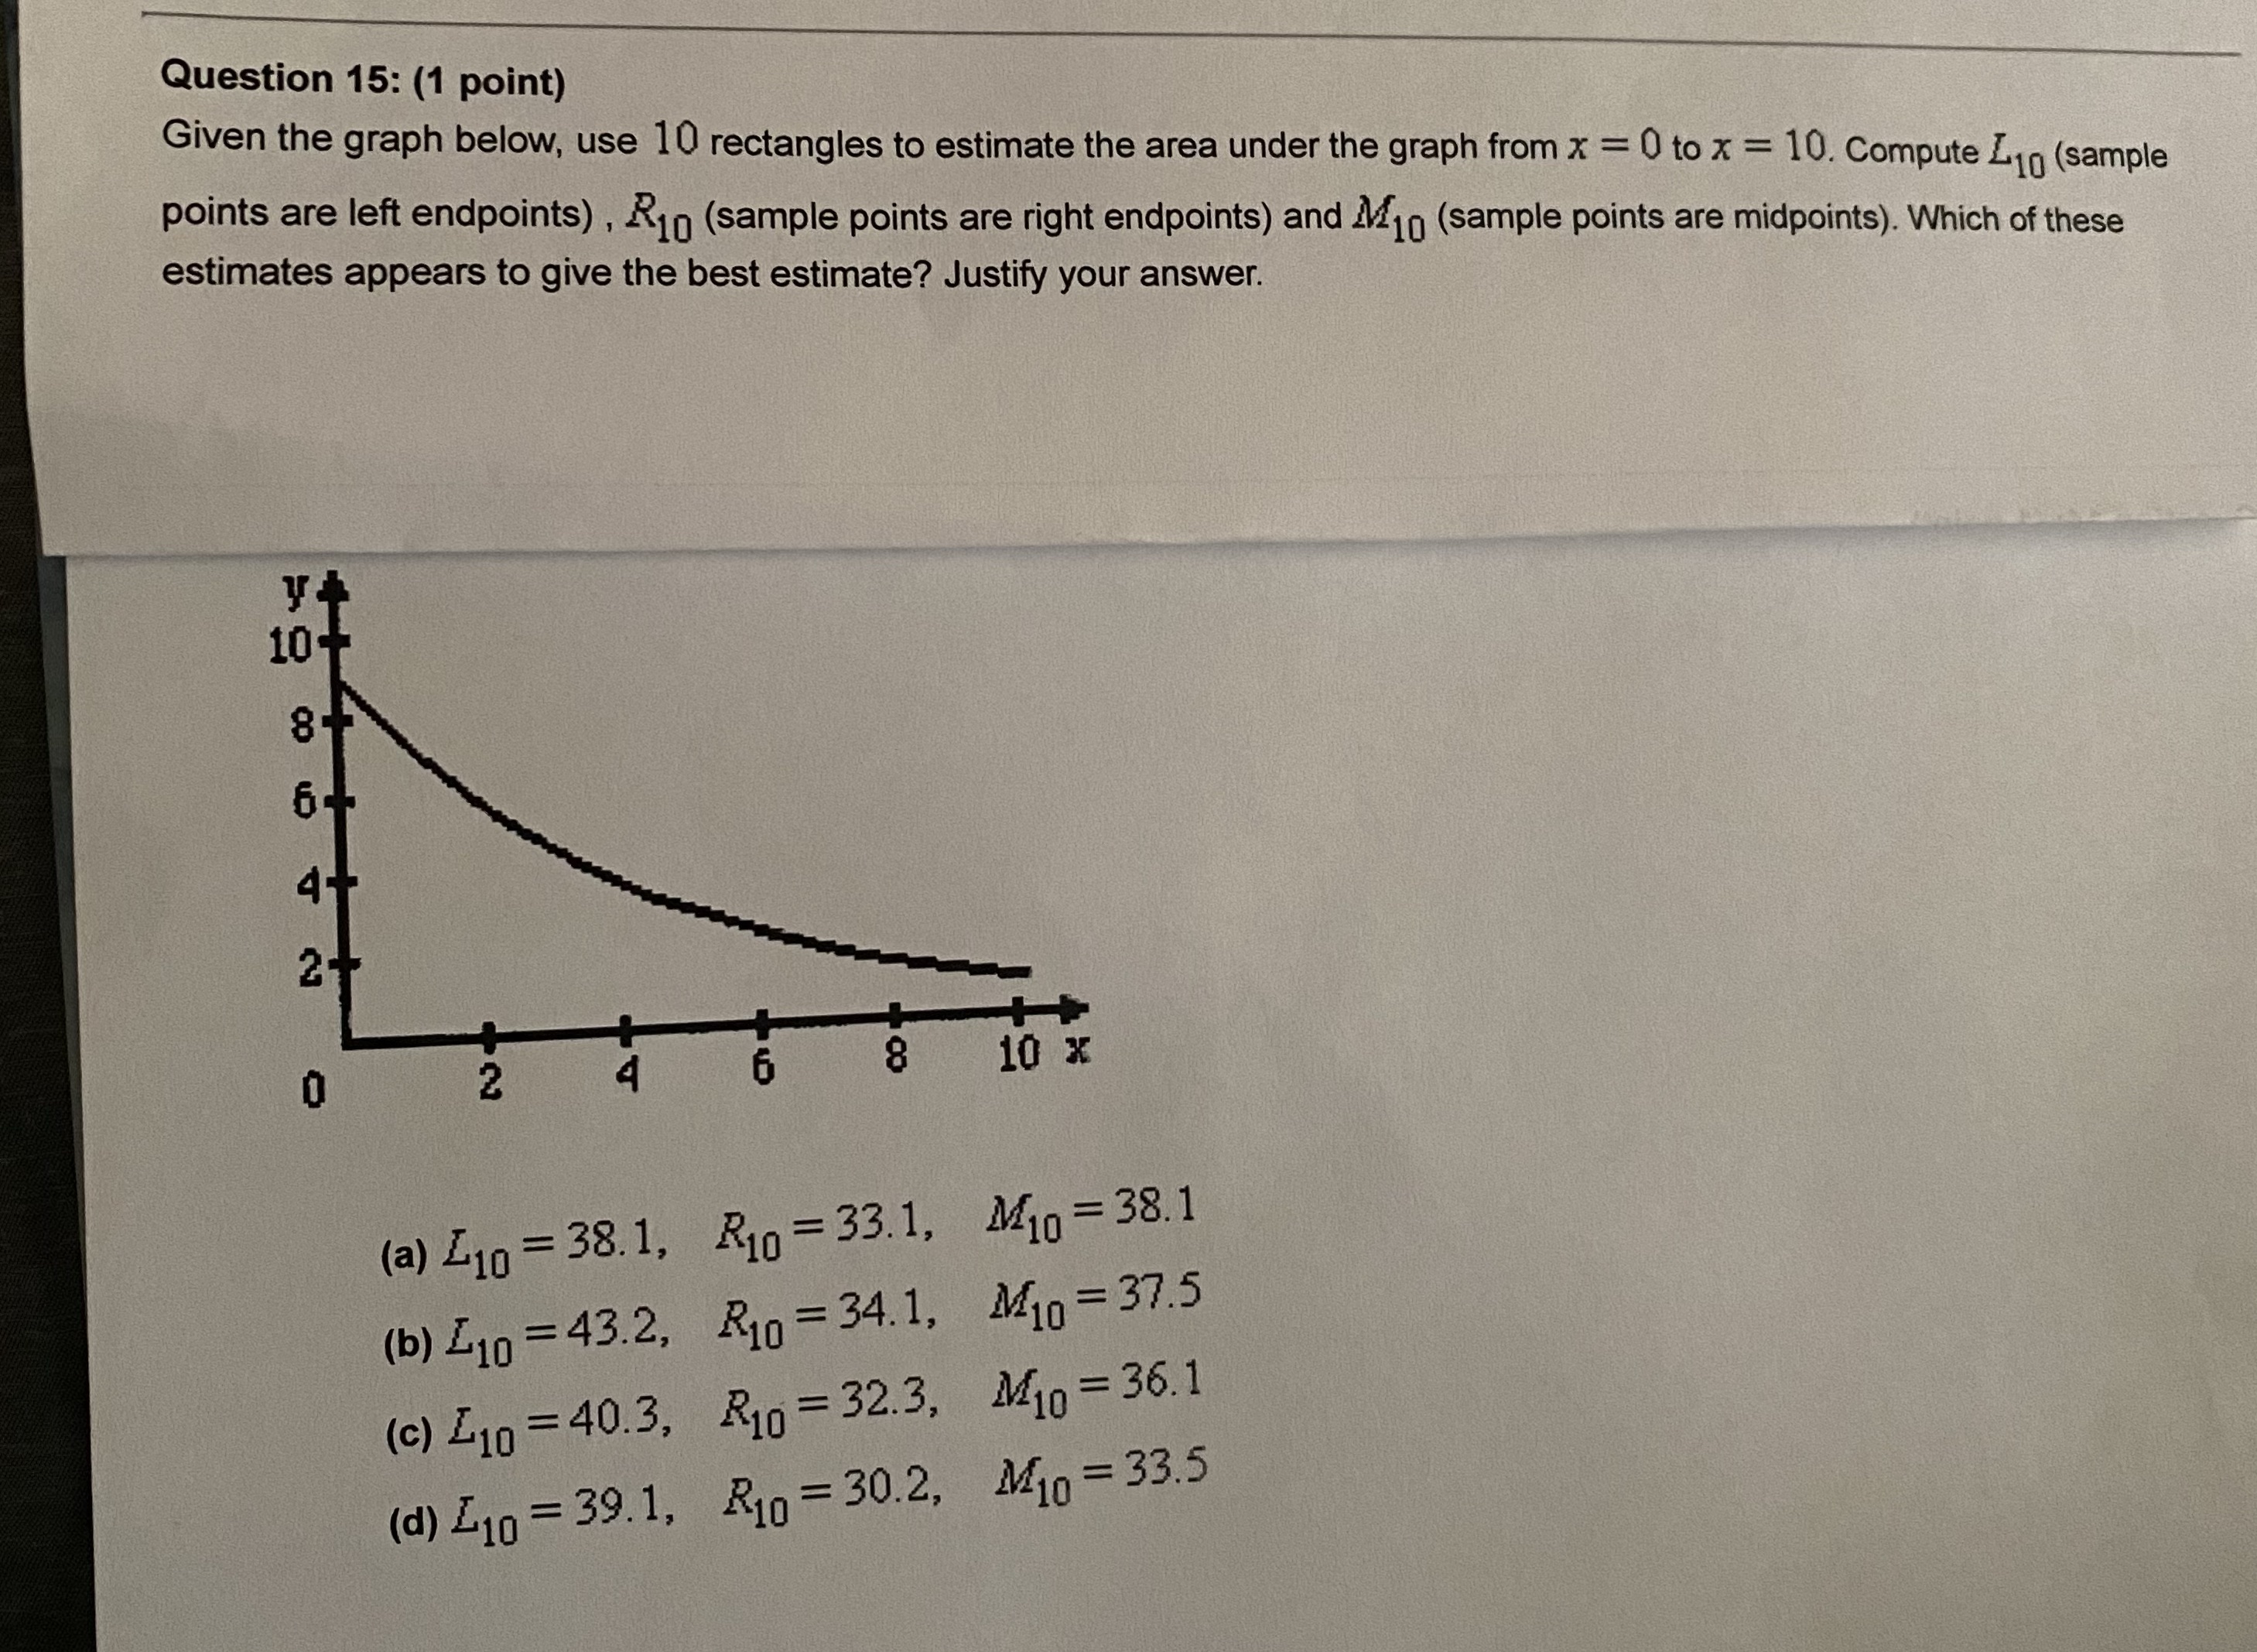
Question 15: (1 point) Given the graph below, use 10 rectangles to estimate the area under the graph from x = 0 to x = 10. Compute L10 (sample points are left endpoints) , R10 (sample points are right endpoints) and 410 (sample points are midpoints). Which of these estimates appears to give the best estimate? Justify your answer. 10 64 4- 24 8 10 x (a) 210 = 38.1, R10 = 33.1, M10 = 38.1 (b) 210 = 43.2, R10 = 34.1, M10 = 37.5 (c) [10 = 40.3, R10 = 32.3, M10 = 36.1 (d) 210 = 39.1, R10 = 30.2, M10 = 33.5
Step by Step Solution
There are 3 Steps involved in it
1 Expert Approved Answer
Step: 1 Unlock

Question Has Been Solved by an Expert!
Get step-by-step solutions from verified subject matter experts
Step: 2 Unlock
Step: 3 Unlock