Question: Please answer Part 2 (Highlighted) There is no other information on this part please let me know if your company can assist or not. Conduct
Please answer Part 2 (Highlighted) There is no other information on this part please let me know if your company can assist or not.
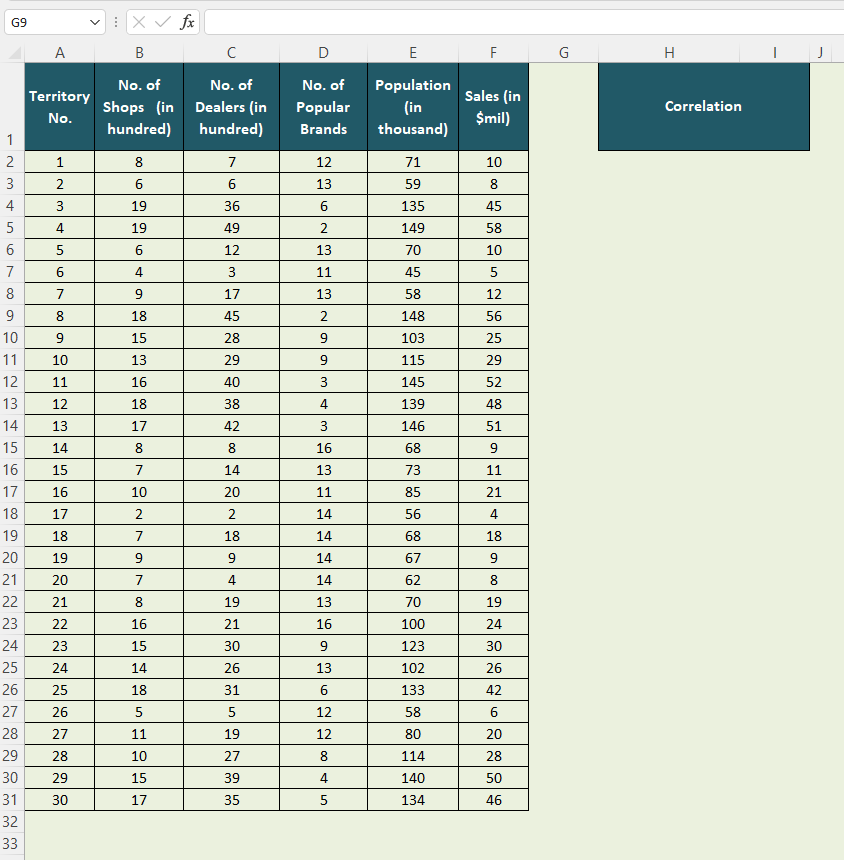
Conduct necessary calculations and visualizations to answer the questions. Subroit your Excel spreadsheet(s) with calculations/ visualizations to the assignment dropbox before the posted deadline. You may submit additional Excel spreadsheets if you feel they are necessary to support your answers. Prepare a report, which includes your answers to the assignment questions. Your answers must be entered directly into this Word document below each question. Insert each answer below each question on this document and use as much space as needed. Grading A total of 5 points is possible for this assignment. This includes the point values which are assigned to each question (point values are noted next to each question below) plus 1 point which are earned based on following the prescribed assignment format, and the proper writing style and APA format. Background Magic Foods is a leading manufacturer of pickles, spice pastes, instant mixes. With quality products and customer satisfaction, Magic foods maintains a leading position in the processed food section y widening its customer base. However, very recently the company witnessed an increase in competition resulting in a decrease in its sales. To analyze the factors driving the sales, company collected data across 30 territories on five important factors which were determined by company leadership to be crucial in determining the sales: market potential in the territory, number of shops selling processed foods, number of dealers in each territory, number of brands and population of each territory. Part 1 (1 point): Question: Define a problem statement which reflects the challenge facing Magic Foods leadership. Part 2 (3 points): Apply descriptive modeling to analyze relationships between company sales and at least two predictor variables. Discuss the results of your analysis, implications for future data analysis. Illustrate your answer with appropriate statistics and visualizations. Provide recommendations for the Magic Foods management. G9 A B D F G H J 1 X fx B No. of No. of Shops (in Dealers (in hundred) hundred) Territory No. No. of Popular Brands E Population (in thousand) Sales (in $mil) Correlation 1 1 12 10 13 2 3 4 5 6 2 3 8 6 19 19 6 7 6 36 49 12 6 N 4 5 71 59 135 149 70 45 58 13 6 4 3 11 7 9 o 8 18 7 8 9 10 11 12 13 17 45 28 13 2 9 8 45 58 10 5 12 56 25 29 52 48 51 9 11 9 15 13 10 29 9 . 11 16 3 12 18 3 4 3 16 17 8 40 38 42 8 14 13 14 15 16 148 103 115 145 139 146 68 73 85 56 68 67 62 7 13 20 11 21 10 2 17 2 14 TR 4 18 7 18 14 18 19 9 9 14 9 20 7 4 14 8 21 8 19 13 70 19 21 24 14 15 16 17 18 19 20 21 22 23 24 25 26 27 28 29 30 31 32 33 16 15 14 18 30 26 22 23 24 25 26 27 16 9 13 100 123 102 133 30 26 42 31 6 5 5 12 6 12 11 10 19 27 28 8 58 80 114 140 134 20 28 50 46 15 4 29 30 39 35 17 5 Conduct necessary calculations and visualizations to answer the questions. Subroit your Excel spreadsheet(s) with calculations/ visualizations to the assignment dropbox before the posted deadline. You may submit additional Excel spreadsheets if you feel they are necessary to support your answers. Prepare a report, which includes your answers to the assignment questions. Your answers must be entered directly into this Word document below each question. Insert each answer below each question on this document and use as much space as needed. Grading A total of 5 points is possible for this assignment. This includes the point values which are assigned to each question (point values are noted next to each question below) plus 1 point which are earned based on following the prescribed assignment format, and the proper writing style and APA format. Background Magic Foods is a leading manufacturer of pickles, spice pastes, instant mixes. With quality products and customer satisfaction, Magic foods maintains a leading position in the processed food section y widening its customer base. However, very recently the company witnessed an increase in competition resulting in a decrease in its sales. To analyze the factors driving the sales, company collected data across 30 territories on five important factors which were determined by company leadership to be crucial in determining the sales: market potential in the territory, number of shops selling processed foods, number of dealers in each territory, number of brands and population of each territory. Part 1 (1 point): Question: Define a problem statement which reflects the challenge facing Magic Foods leadership. Part 2 (3 points): Apply descriptive modeling to analyze relationships between company sales and at least two predictor variables. Discuss the results of your analysis, implications for future data analysis. Illustrate your answer with appropriate statistics and visualizations. Provide recommendations for the Magic Foods management. G9 A B D F G H J 1 X fx B No. of No. of Shops (in Dealers (in hundred) hundred) Territory No. No. of Popular Brands E Population (in thousand) Sales (in $mil) Correlation 1 1 12 10 13 2 3 4 5 6 2 3 8 6 19 19 6 7 6 36 49 12 6 N 4 5 71 59 135 149 70 45 58 13 6 4 3 11 7 9 o 8 18 7 8 9 10 11 12 13 17 45 28 13 2 9 8 45 58 10 5 12 56 25 29 52 48 51 9 11 9 15 13 10 29 9 . 11 16 3 12 18 3 4 3 16 17 8 40 38 42 8 14 13 14 15 16 148 103 115 145 139 146 68 73 85 56 68 67 62 7 13 20 11 21 10 2 17 2 14 TR 4 18 7 18 14 18 19 9 9 14 9 20 7 4 14 8 21 8 19 13 70 19 21 24 14 15 16 17 18 19 20 21 22 23 24 25 26 27 28 29 30 31 32 33 16 15 14 18 30 26 22 23 24 25 26 27 16 9 13 100 123 102 133 30 26 42 31 6 5 5 12 6 12 11 10 19 27 28 8 58 80 114 140 134 20 28 50 46 15 4 29 30 39 35 17 5


