

Question: please answer part 2 using Excel and show work and formula Intro The retur statistics for two stocks and T-bills are given below. C Stock
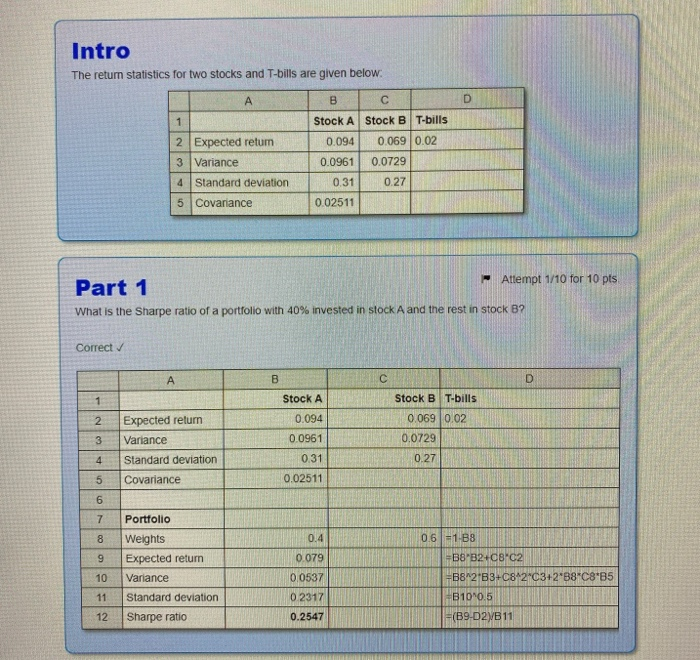
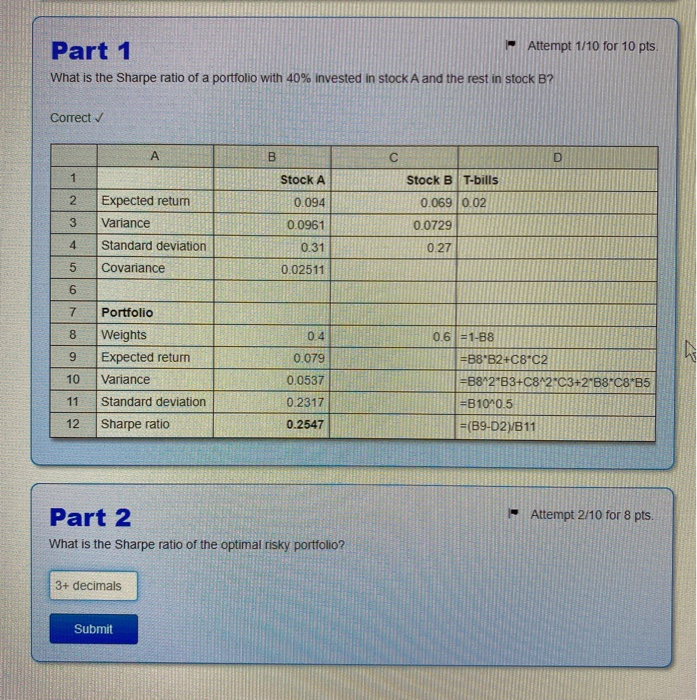
Intro The retur statistics for two stocks and T-bills are given below. C Stock A Stock B T-bills 2 Expected retum 0.094 0.069 0.02 3 Variance 0.0961 0.0729 4 Standard deviation 0.31 0.27 5 Covariance 0.02511 Part 1 Attempt 1/10 for 10 pts What is the Sharpe ratio of a portfolio with 40% invested in stock A and the rest in stock 8? Correct 2 Expected return Variance Standard deviation Covariance Stock A 0.094 0.0961 0.31 0.02511 Stock B T-bills 0.069 0.02 0.0729 0.27 Portfolio Weights Expected return Variance Standard deviation Sharpe ratio 10 0.079 0.0537 02317 0.2547 06 -1-88 -B8B24C8-C2 +B8-2B3+C8*2C3+2*88*C8*85 B10'0.5 = (B9-02)B11 11 12 - Attempt 1/10 for 10 pts Part 1 What is the Sharpe ratio of a portfolio with 40% invested in stock A and the rest in stock B? Correct 1 T Stock A Stock B T-bills Expected retum 0.094 0.069 0.02 Variance 0.0961 Standard deviation 0.31 0.27 Covariance 0.02511 0.0729 3 4 5 7 10 11 12 Portfolio Weights Expected return Variance Standard deviation Sharpe ratio 0.079 0.0537 0.2317 0.2547 0.6 =1-88 =B8*B2+C8*C2 =B8^2'B3+C8^2*C3+2*88*C8*85 =B10^0.5 =(B9-D2/B11 Attempt 2/10 for 8 pts. Part 2 What is the Sharpe ratio of the optimal risky portfolio? 3+ decimals Submit
Step by Step Solution
There are 3 Steps involved in it

Get step-by-step solutions from verified subject matter experts