

Question: Hi I need help with Part 2! Excel should help with these! Thanks! Intro The return statistics for two stocks and T-bills are given below:
Hi I need help with Part 2! Excel should help with these! Thanks!
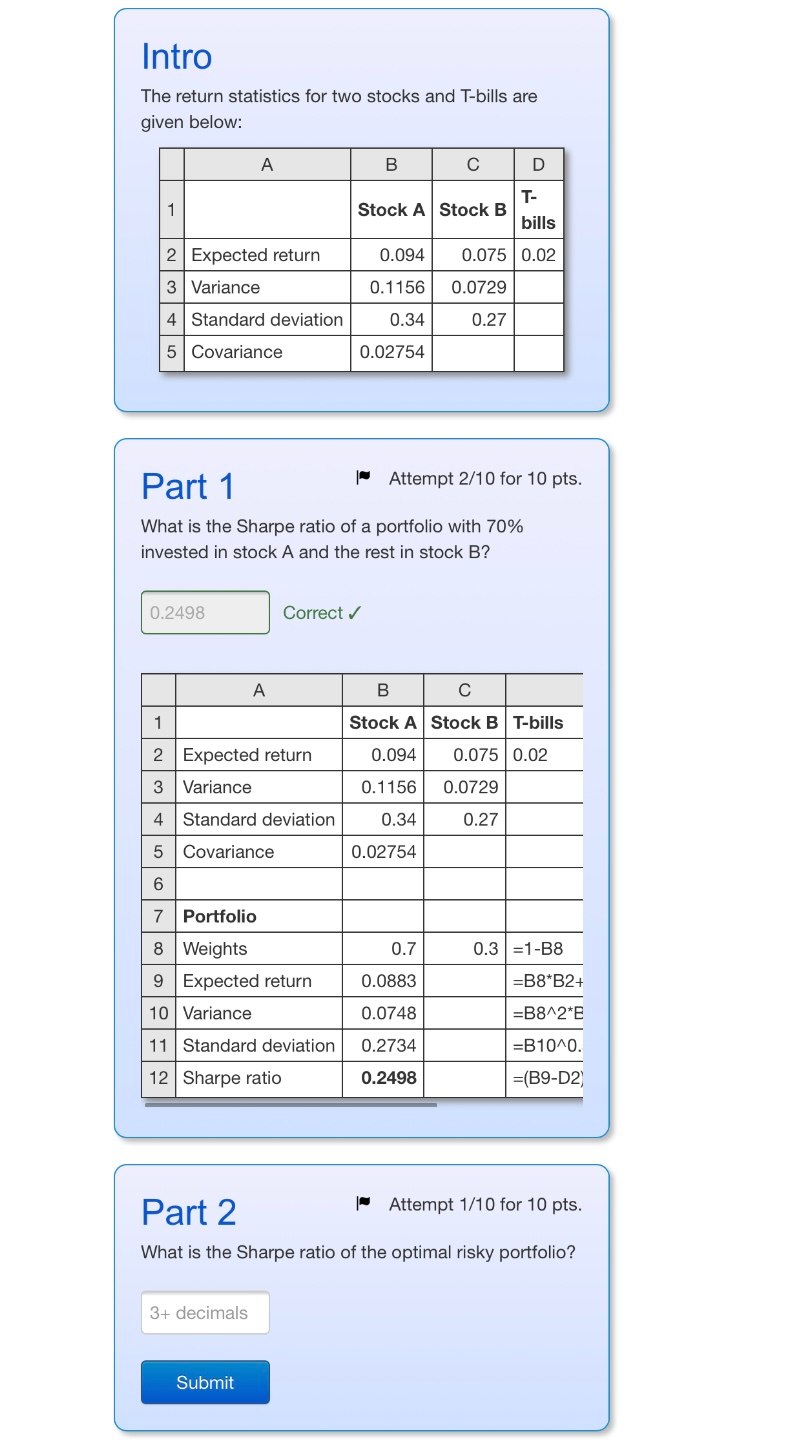
Intro The return statistics for two stocks and T-bills are given below: A B C D 1 Stock A Stock B T- bills 0.094 0.075 0.02 2 Expected return 3 Variance 0.1156 0.0729 4 Standard deviation 0.34 0.27 5 Covariance 0.02754 Part 1 "Attempt 2/10 for 10 pts. What is the Sharpe ratio of a portfolio with 70% invested in stock A and the rest in stock B? 0.2498 Correct A B C 1 Stock A Stock BT-bills 0.094 0.075 0.02 2 Expected return 3 Variance 0.1156 0.0729 4 Standard deviation 0.34 0.27 5 Covariance 0.02754 6 7 Portfolio 0.7 0.3 =1-B8 8 Weights 9 Expected return 10 Variance 0.0883 =B8*B2+ 0.0748 =B8^2*E 11 Standard deviation 0.2734 =B10^0. 12 Sharpe ratio 0.2498 =(B9-D2) Part 2 - Attempt 1/10 for 10 pts. What is the Sharpe ratio of the optimal risky portfolio? 3+ decimals Submit
Step by Step Solution
There are 3 Steps involved in it

Get step-by-step solutions from verified subject matter experts