

Question: please answer part a and then part b thanks Ten samples of 15 parts each were taken from an ongoing process to establish a p
please answer part a and then part b thanks 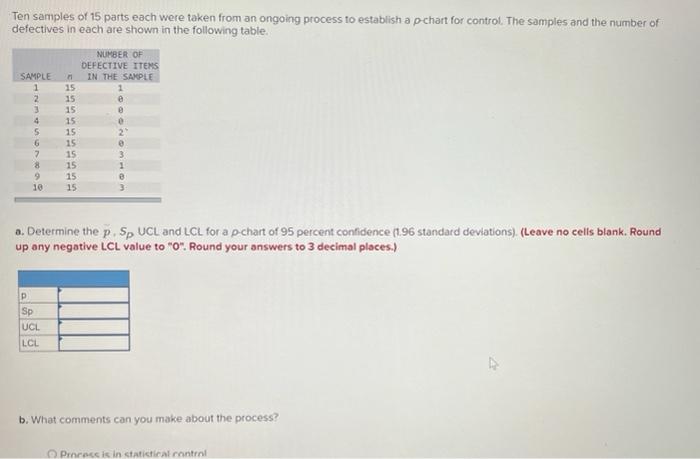
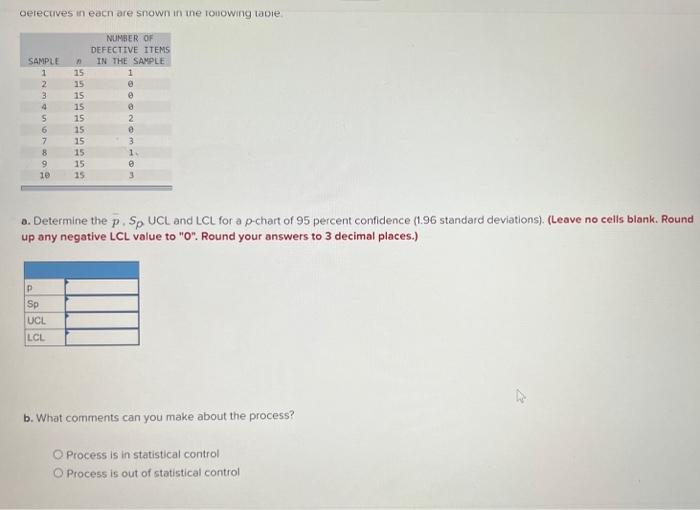
Ten samples of 15 parts each were taken from an ongoing process to establish a p chart for control. The samples and the number of defectives in each are shown in the following table. NUMBER OF DEFECTIVE ITEMS IN THE SAMPLE e SAMPLE 1 2 3 4 5 6 7 8 9 10 15 15 15 15 15 15 15 15 15 15 3 1 Fr o. Determine the p. Sp UCL and LCL for a pchart of 95 percent confidence (1.96 standard deviations) (Leave no cells blank. Round up any negative LCL value to "O". Round your answers to 3 decimal places.) Sp UCL LCL b. What comments can you make about the process? Process is in statisticat control cerectives in each are snown in the Tonowing table SAMPLE 1 2 3 NUMBER OF DEFECTIVE ITEMS IN THE SAMPLE 1 @ OWN 15 15 15 15 15 15 15 15 15 2 6 7 8 9 10 3 1 3 . Determine the p. Sp UCL and LCL for a p-chart of 95 percent confidence (1.96 standard deviations). (Leave no cells blank. Round up any negative LCL value to "O". Round your answers to 3 decimal places.) p Sp UCL LCL b. What comments can you make about the process? O Process is in statistical control O Process is out of statistical control
Step by Step Solution
There are 3 Steps involved in it
1 Expert Approved Answer
Step: 1 Unlock

Question Has Been Solved by an Expert!
Get step-by-step solutions from verified subject matter experts
Step: 2 Unlock
Step: 3 Unlock