

Question: please use step by step in excel format! 7. Ten samples of 15 parts each were taken from an ongoing process to establish a p-chart
please use step by step in excel format! 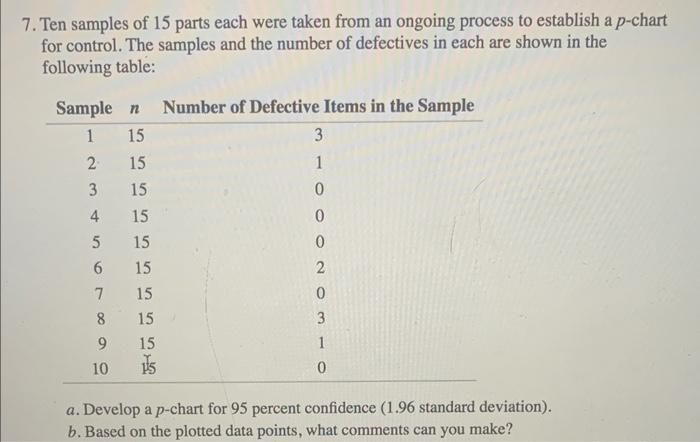
7. Ten samples of 15 parts each were taken from an ongoing process to establish a p-chart for control. The samples and the number of defectives in each are shown in the following table: a. Develop a p-chart for 95 percent confidence (1.96 standard deviation). b. Based on the plotted data points, what comments can you make
Step by Step Solution
There are 3 Steps involved in it
1 Expert Approved Answer
Step: 1 Unlock

Question Has Been Solved by an Expert!
Get step-by-step solutions from verified subject matter experts
Step: 2 Unlock
Step: 3 Unlock