

Question: please answer part b use excel to make pivot chart like that one Note: Format the cells with appropriate Units. b) Create a PIVOT Chart
please answer part b 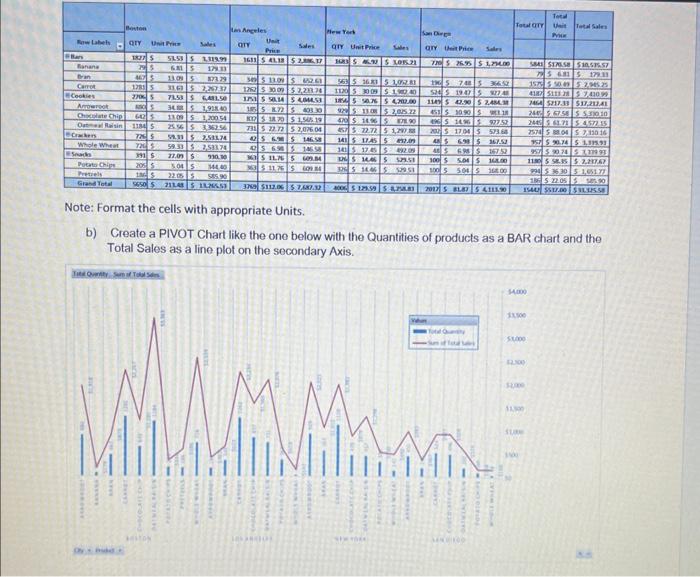
use excel to make pivot chart like that one
Note: Format the cells with appropriate Units. b) Create a PIVOT Chart like the one below with the Quantities of products as a BAR chart and the Total Sales as a line plot on the secondary Axis. Note: Format the cells with appropriate Units. b) Create a PIVOT Chart like the one below with the Quantities of products as a BAR chart and the Total Sales as a line plot on the secondary Axis
Step by Step Solution
There are 3 Steps involved in it
1 Expert Approved Answer
Step: 1 Unlock

Question Has Been Solved by an Expert!
Get step-by-step solutions from verified subject matter experts
Step: 2 Unlock
Step: 3 Unlock