

Question: Please answer parts (b) and (c) thanks!! Remember to plot the graphs using Excel. Tabulate vour results under the following headings: (b) Plot the profiles
Please answer parts (b) and (c) thanks!! Remember to plot the graphs using Excel.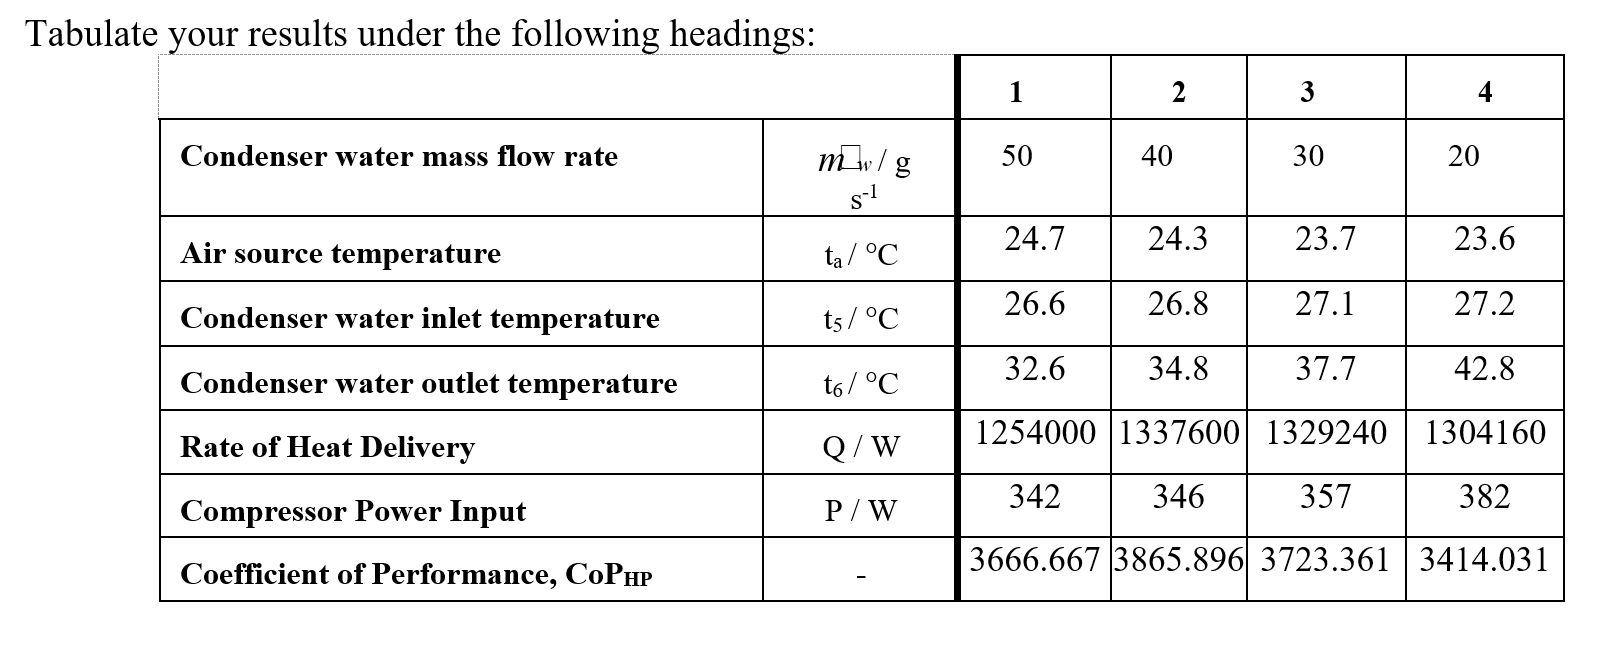
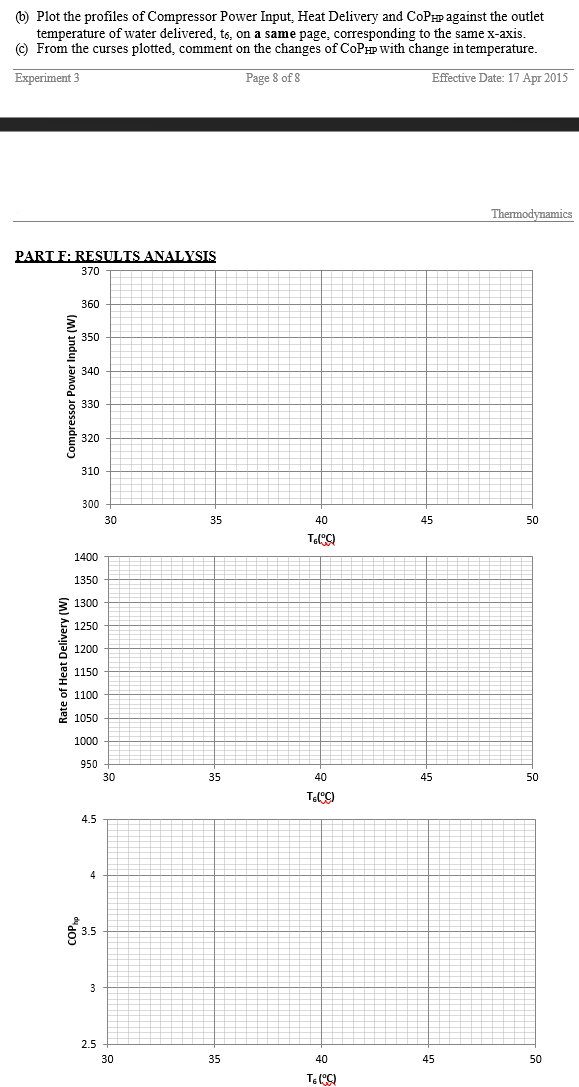
Tabulate vour results under the following headings: (b) Plot the profiles of Compressor Power Input, Heat Delivery and CoPpp against the outlet temperature of water delivered, t6, on a same page, corresponding to the same x-axis. (c) From the curses plotted, comment on the changes of CoPPPP with change in temperature
Step by Step Solution
There are 3 Steps involved in it
1 Expert Approved Answer
Step: 1 Unlock

Question Has Been Solved by an Expert!
Get step-by-step solutions from verified subject matter experts
Step: 2 Unlock
Step: 3 Unlock