

Question: Please answer parts E and F. (D). If the above aquifer is not fully confined, but is overlain by a 8-ft-thick leaky, confining layer with
Please answer parts E and F.
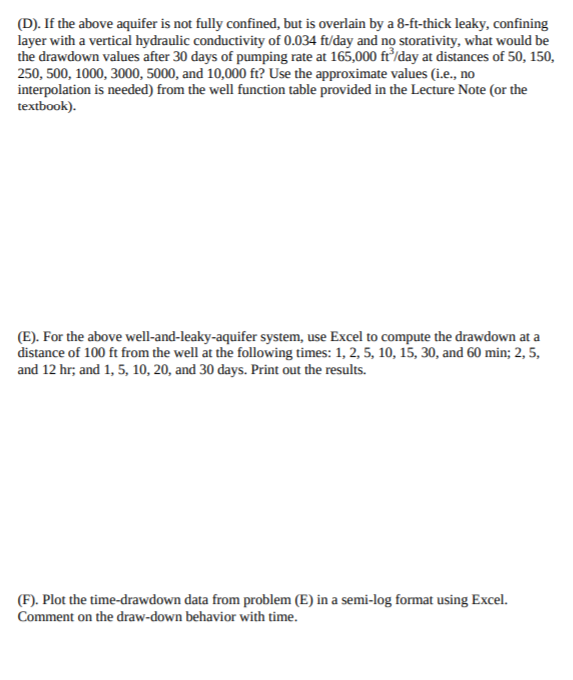
(D). If the above aquifer is not fully confined, but is overlain by a 8-ft-thick leaky, confining layer with a vertical hydraulic conductivity of 0.034 ft/day and no storativity, what would be the drawdown values after 30 days of pumping rate at 165,000 ft/day at distances of 50, 150, 250, 500, 1000, 3000, 5000, and 10,000 ft? Use the approximate values (i.e., no interpolation is needed) from the well function table provided in the Lecture Note (or the textbook). (E). For the above well-and-leaky-aquifer system, use Excel to compute the drawdown at a distance of 100 ft from the well at the following times: 1, 2, 5, 10, 15, 30, and 60 min; 2,5, and 12 hr; and 1, 5, 10, 20, and 30 days. Print out the results. (F). Plot the time-drawdown data from problem (E) in a semi-log format using Excel. Comment on the draw-down behavior with time. (D). If the above aquifer is not fully confined, but is overlain by a 8-ft-thick leaky, confining layer with a vertical hydraulic conductivity of 0.034 ft/day and no storativity, what would be the drawdown values after 30 days of pumping rate at 165,000 ft/day at distances of 50, 150, 250, 500, 1000, 3000, 5000, and 10,000 ft? Use the approximate values (i.e., no interpolation is needed) from the well function table provided in the Lecture Note (or the textbook). (E). For the above well-and-leaky-aquifer system, use Excel to compute the drawdown at a distance of 100 ft from the well at the following times: 1, 2, 5, 10, 15, 30, and 60 min; 2,5, and 12 hr; and 1, 5, 10, 20, and 30 days. Print out the results. (F). Plot the time-drawdown data from problem (E) in a semi-log format using Excel. Comment on the draw-down behavior with time
Step by Step Solution
There are 3 Steps involved in it

Get step-by-step solutions from verified subject matter experts