

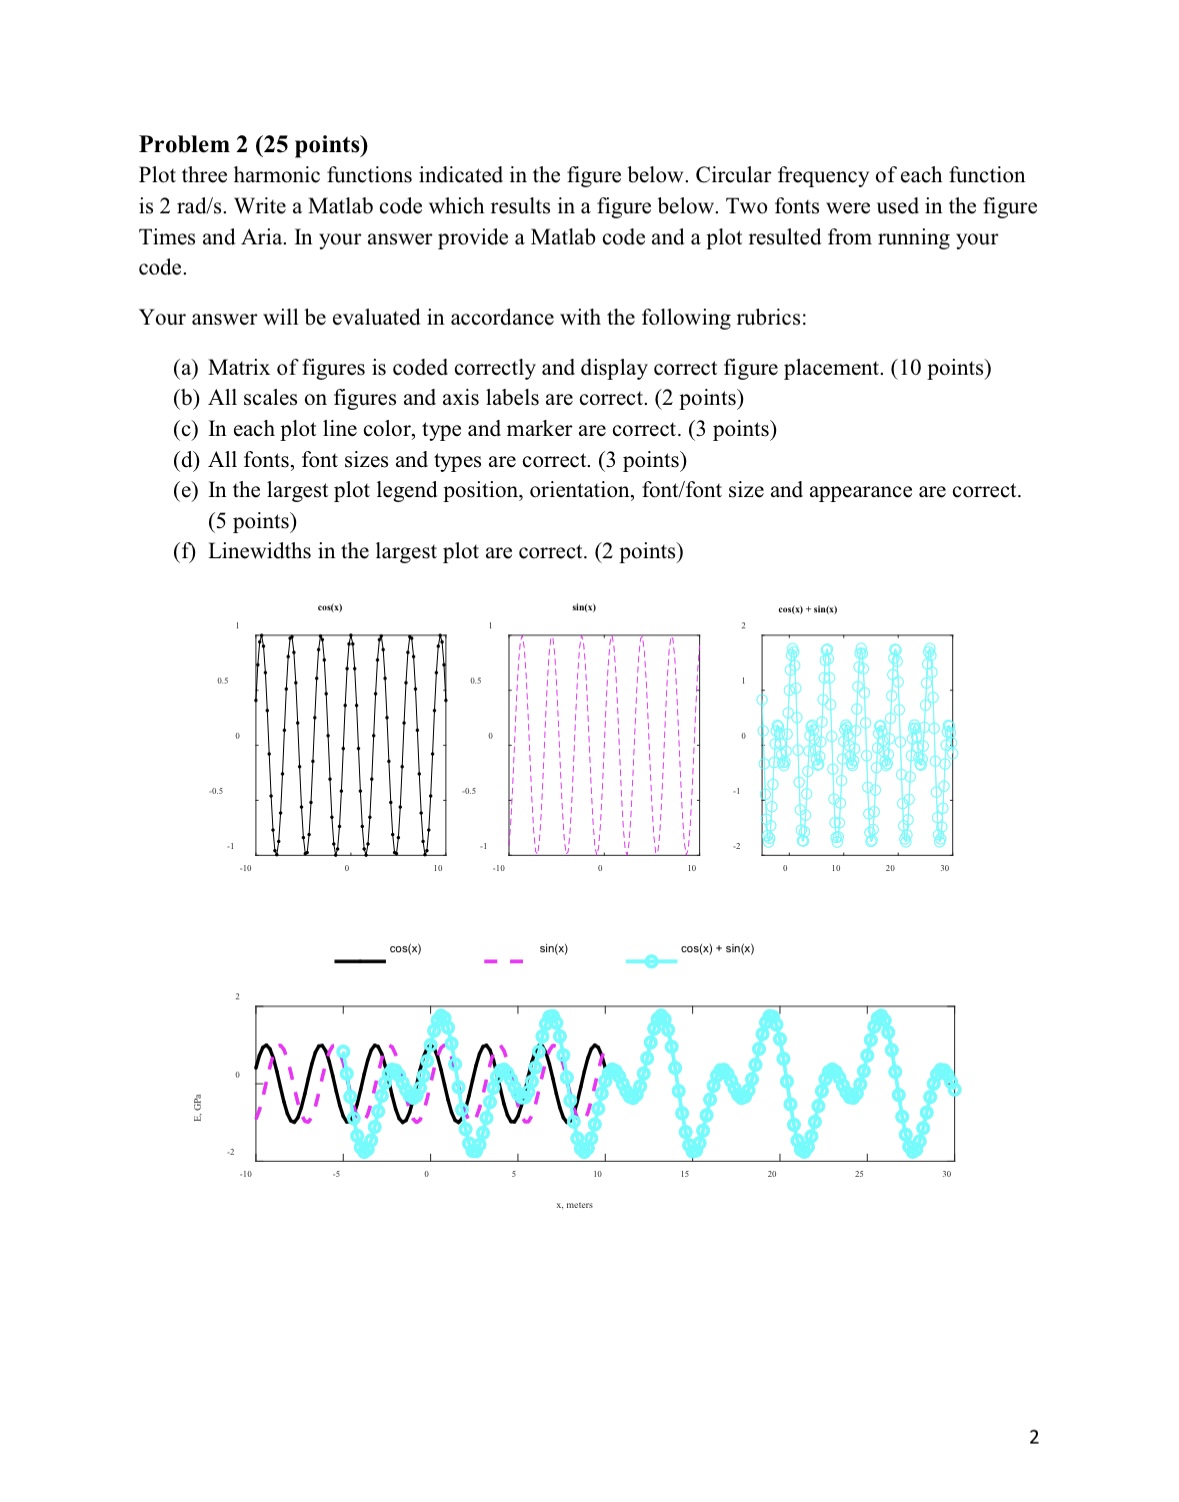
Question: Please answer Problem 1(a-f) and Problem 2(a-f) and show the codes. If you can, please briefly describe the code and what it does(like a summary).
Please answer Problem 1(a-f) and Problem 2(a-f) and show the codes. If you can, please briefly describe the code and what it does(like a summary).
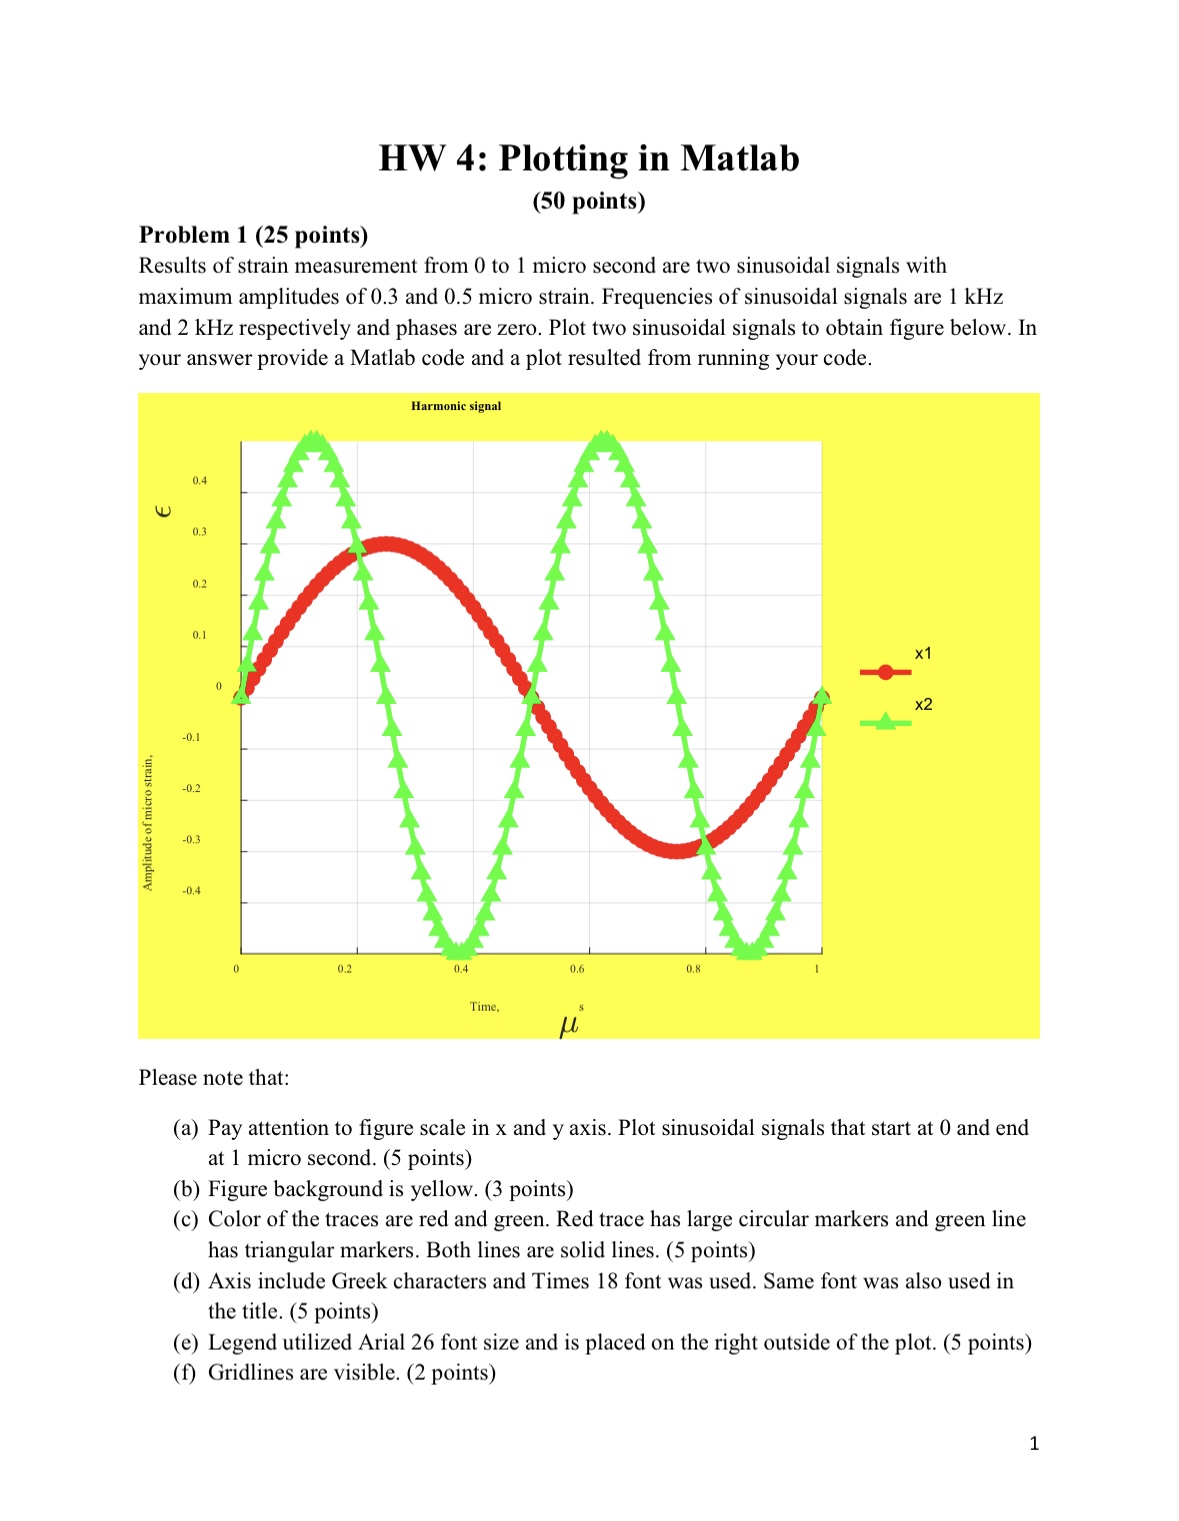
Amplitude of micro strain, Problem 1 (25 points) HW 4: Plotting in Matlab (50 points) Results of strain measurement from 0 to 1 micro second are two sinusoidal signals with maximum amplitudes of 0.3 and 0.5 micro strain. Frequencies of sinusoidal signals are 1 kHz and 2 kHz respectively and phases are zero. Plot two sinusoidal signals to obtain figure below. In your answer provide a Matlab code and a plot resulted from running your code. -0.1 -0.2 -0.3 -0.4 0.4 0.3 0.2 0.1 0 Harmonic signal 0 0.2 0.4 0.6 0.8 Time, x1 x2 Please note that: (a) Pay attention to figure scale in x and y axis. Plot sinusoidal signals that start at 0 and end at 1 micro second. (5 points) (b) Figure background is yellow. (3 points) (c) Color of the traces are red and green. Red trace has large circular markers and green line has triangular markers. Both lines are solid lines. (5 points) (d) Axis include Greek characters and Times 18 font was used. Same font was also used in the title. (5 points) (e) Legend utilized Arial 26 font size and is placed on the right outside of the plot. (5 points) (f) Gridlines are visible. (2 points) 1
Step by Step Solution
There are 3 Steps involved in it

Get step-by-step solutions from verified subject matter experts