

Question: Please answer Q2. ! Detected Relative Intensity Trial 1 Trial 2 Trial 3 10.556 10.603 10.509 0 nM 5 nM 10.524 10.538 10.519 10 nM
Please answer Q2.
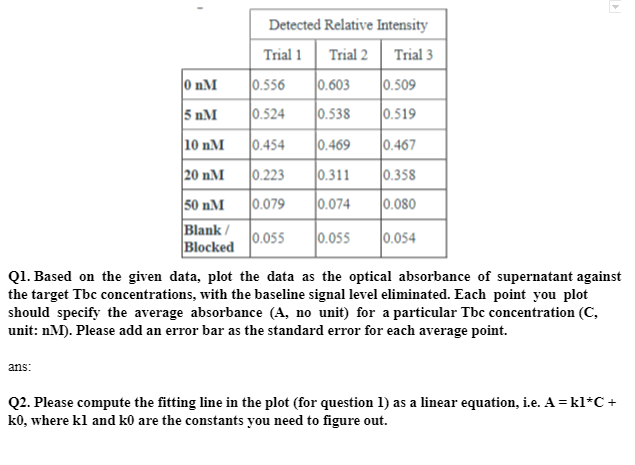
! Detected Relative Intensity Trial 1 Trial 2 Trial 3 10.556 10.603 10.509 0 nM 5 nM 10.524 10.538 10.519 10 nM 10.454 10.469 10.467 20 nM 10.223 10.311 10.358 50 nM 10.079 0.074 10.080 Blank/ 10.055 10.055 Blocked 10.054 Q1. Based on the given data, plot the data as the optical absorbance of supernatant against the target Tbc concentrations, with the baseline signal level eliminated. Each point you plot should specify the average absorbance (A, no unit) for a particular Tbc concentration (C, unit: nM). Please add an error bar as the standard error for each average point. ans: Q2. Please compute the fitting line in the plot (for question 1) as a linear equation, i.e. A=kl*C+ ko, where kl and ko are the constants you need to figure out
Step by Step Solution
There are 3 Steps involved in it

Get step-by-step solutions from verified subject matter experts