

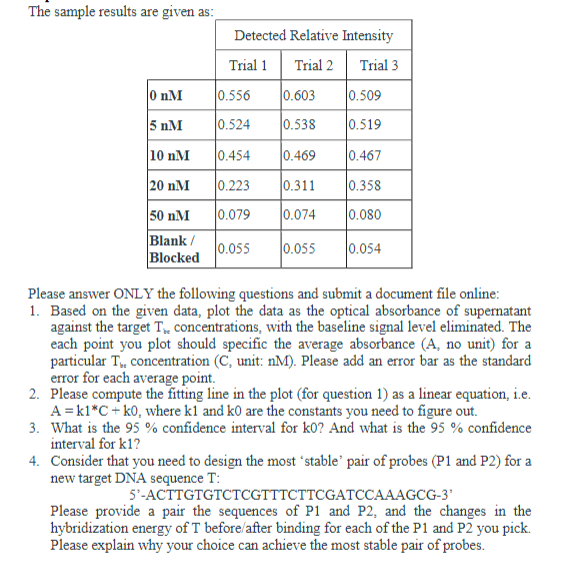
Question: Please answer Q4. The sample results are given as: Detected Relative Intensity Trial 1 Trial 2 Trial 3 0 nM 10.556 0.603 0.509 5 nM
Please answer Q4.
The sample results are given as: Detected Relative Intensity Trial 1 Trial 2 Trial 3 0 nM 10.556 0.603 0.509 5 nM 0.524 0.538 0.519 10 nM 0.454 0.469 0.467 20 nM 0.223 10.311 10.358 0.079 0.074 10.080 50 nM Blank/ Blocked 0.055 0.055 0.054 Please answer ONLY the following questions and submit a document file online: 1. Based on the given data, plot the data as the optical absorbance of supernatant against the target T. concentrations, with the baseline signal level eliminated. The each point you plot should specific the average absorbance (A, no unit) for a particular T, concentration (C, unit: nM). Please add an error bar as the standard error for each average point. 2. Please compute the fitting line in the plot (for question 1) as a linear equation, i.e. A = k1*C+ko, where ki and ko are the constants you need to figure out. 3. What is the 95% confidence interval for ko? And what is the 95% confidence interval for ki? 4. Consider that you need to design the most stable' pair of probes (P1 and P2) for a new target DNA sequence T: 5-ACTTGTGTCTCGTTTCTTCGATCCAAAGCG-3 Please provide a pair the sequences of P1 and P2, and the changes in the hybridization energy of T before/after binding for each of the P1 and P2 you pick. Please explain why your choice can achieve the most stable pair of probes
Step by Step Solution
There are 3 Steps involved in it

Get step-by-step solutions from verified subject matter experts