

Question: Please answer Q.2.a Scatterplots and Relationship between two Variables The price of the main meal for 30 restaurants was recorded. An independent reviewer rated each
Please answer Q.2.a
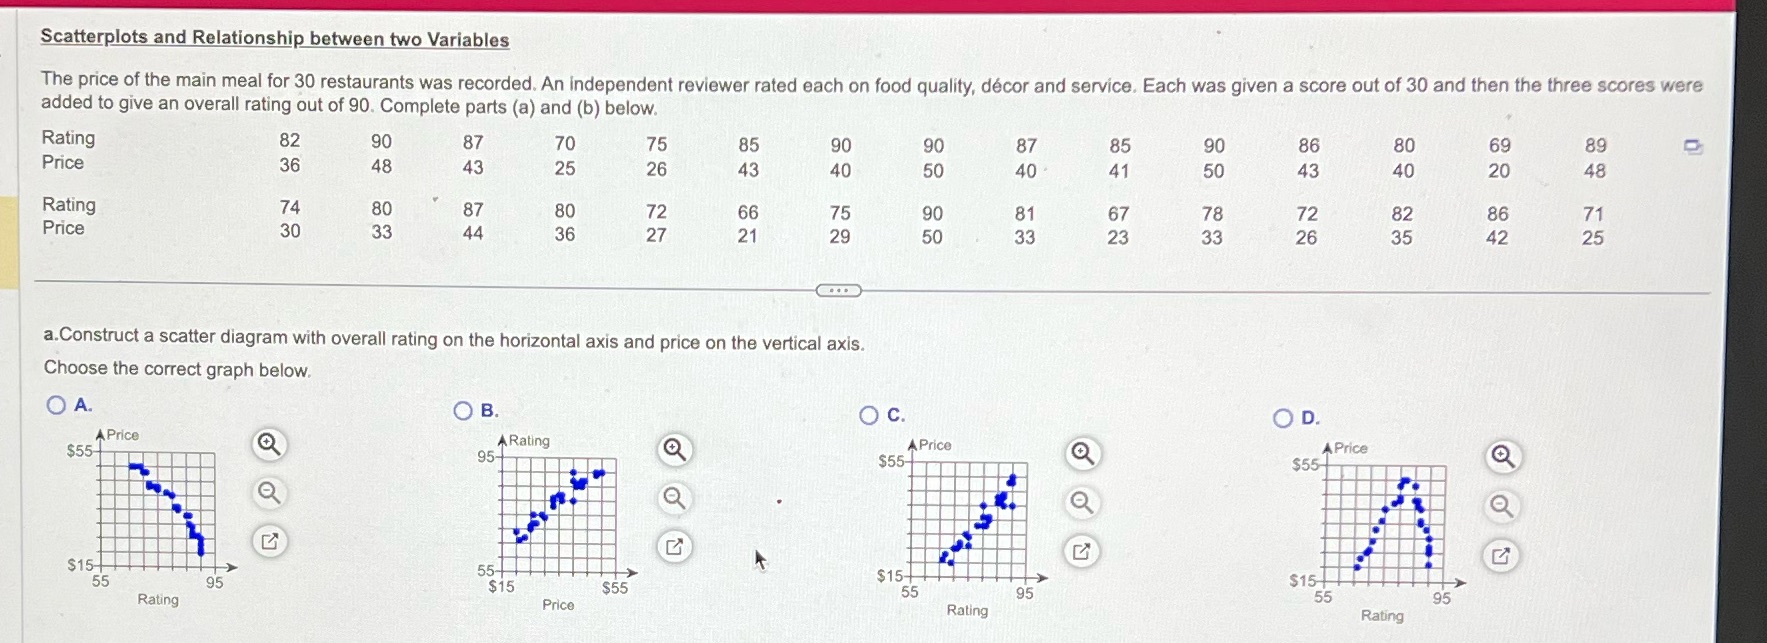
Scatterplots and Relationship between two Variables The price of the main meal for 30 restaurants was recorded. An independent reviewer rated each on food quality, decor and service. Each was given a score out of 30 and then the three scores were added to give an overall rating out of 90. Complete parts (a) and (b) below. Rating 82 90 87 70 75 85 90 90 87 85 90 86 80 69 89 Price 36 48 43 25 26 43 40 50 40 41 50 43 40 20 48 Rating 74 80 87 80 72 66 75 90 81 67 78 72 82 86 71 Price 30 33 44 36 27 21 29 50 33 23 33 26 35 42 25 a.Construct a scatter diagram with overall rating on the horizontal axis and price on the vertical axis. Choose the correct graph below. O A. O B. O c. O D. A Price $55- A Rating A Price 95- A Price $55- $55 $15- 55- 55 95 $15 $15 $55 $15 Rating 55 95 Price 55 95 Rating Rating
Step by Step Solution
There are 3 Steps involved in it

Get step-by-step solutions from verified subject matter experts