

Question: Please answer quality management question A quality consultant was asked to analyze the data from order errors at the Apple distribution center as shown in
Please answer quality management question
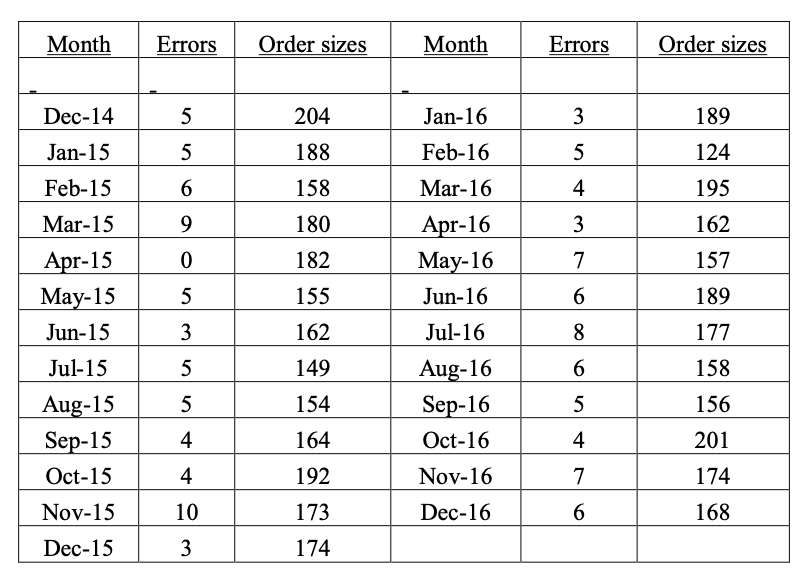
A quality consultant was asked to analyze the data from order errors at the Apple distribution center as shown in the table. The data show the number of orders processed per month and the errors found in those orders. Develop a run chart, a frequency histogram, and a u-chart for these data. What insights do you get from each chart? What would you advise the distribution center manager to do about the errors?
Step by Step Solution
There are 3 Steps involved in it
1 Expert Approved Answer
Step: 1 Unlock

Question Has Been Solved by an Expert!
Get step-by-step solutions from verified subject matter experts
Step: 2 Unlock
Step: 3 Unlock