

Question: Please answer question 12 12) What is the correct scatter plot display for the relationship between the test grade and study hours per week? 130
Please answer question 12
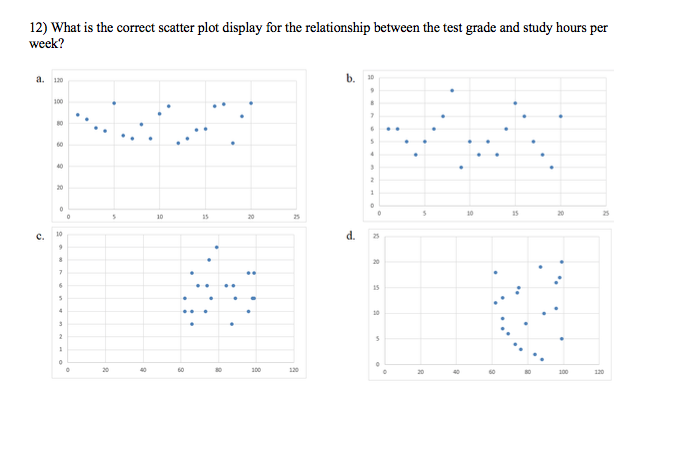
12) What is the correct scatter plot display for the relationship between the test grade and study hours per week? 130 10 H d. 30 100 130
Step by Step Solution
There are 3 Steps involved in it
1 Expert Approved Answer
Step: 1 Unlock

Question Has Been Solved by an Expert!
Get step-by-step solutions from verified subject matter experts
Step: 2 Unlock
Step: 3 Unlock