

Question: PLEASE ANSWER QUESTION 1-3 THE TEAM IS CHESTER AND THE PRODUCTS FOR TEAM CHESTER ARE CAKE, CEDAR, CID, COAT AND LASTLY CURE. Andrews 5.4% 1.30
PLEASE ANSWER QUESTION 1-3
THE TEAM IS CHESTER AND THE PRODUCTS FOR TEAM CHESTER ARE CAKE, CEDAR, CID, COAT AND LASTLY CURE. 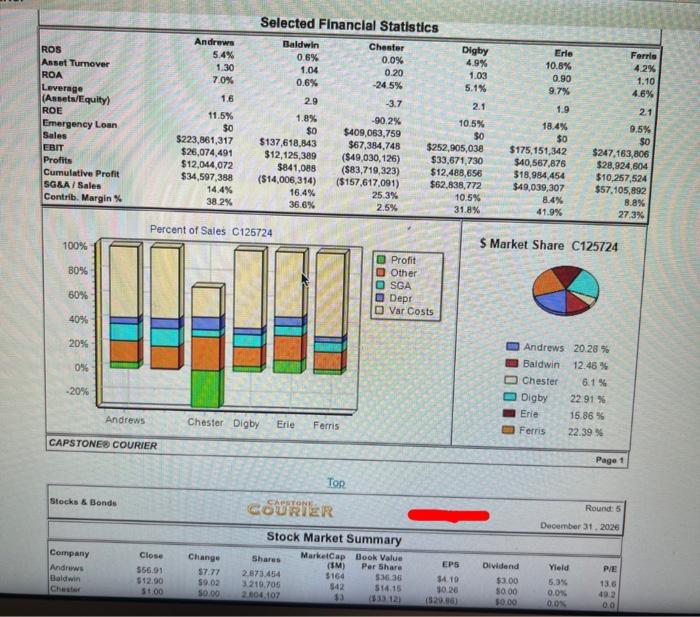
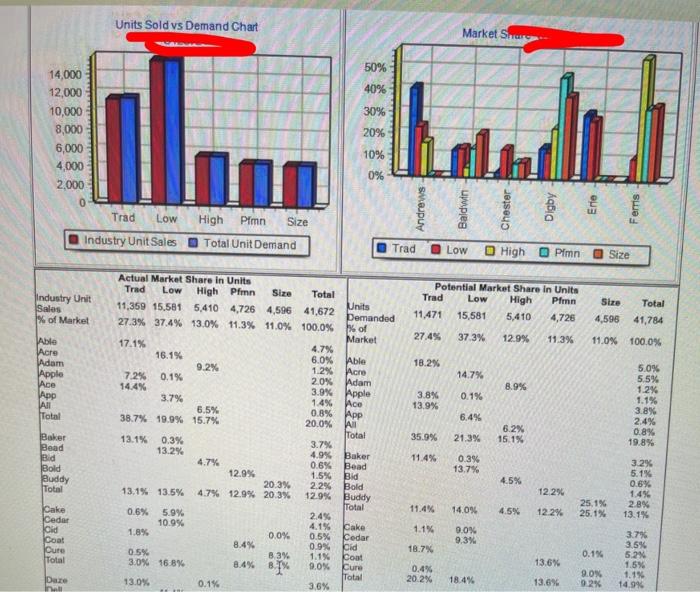
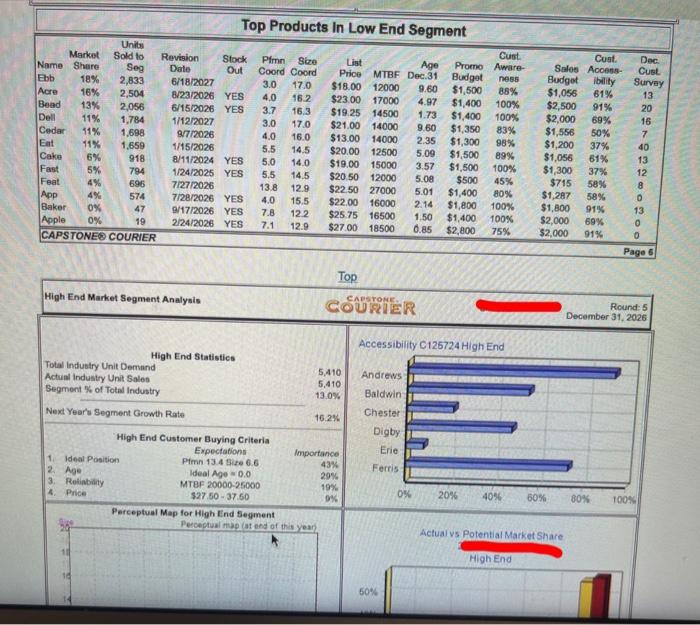
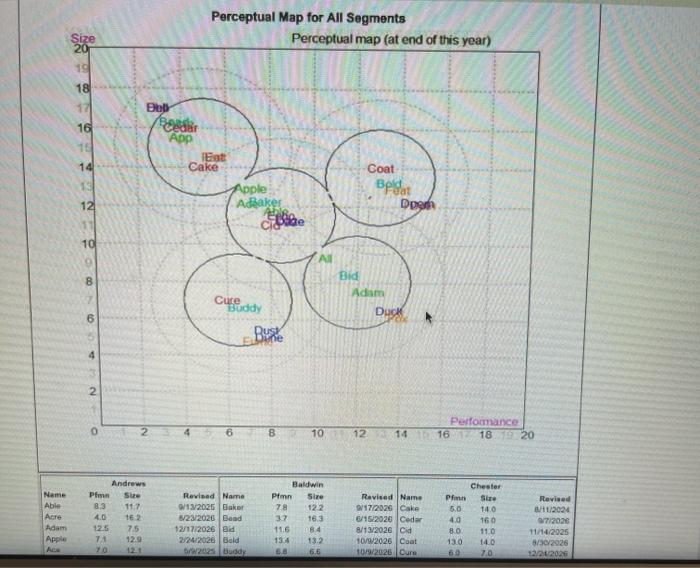
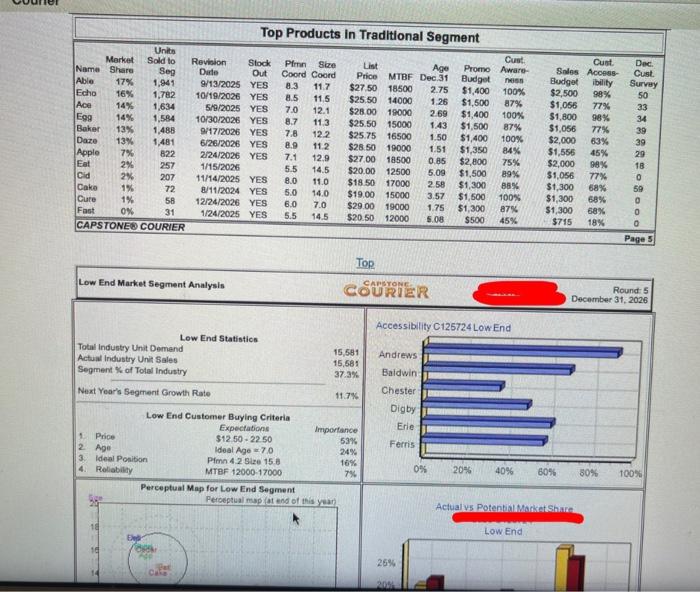
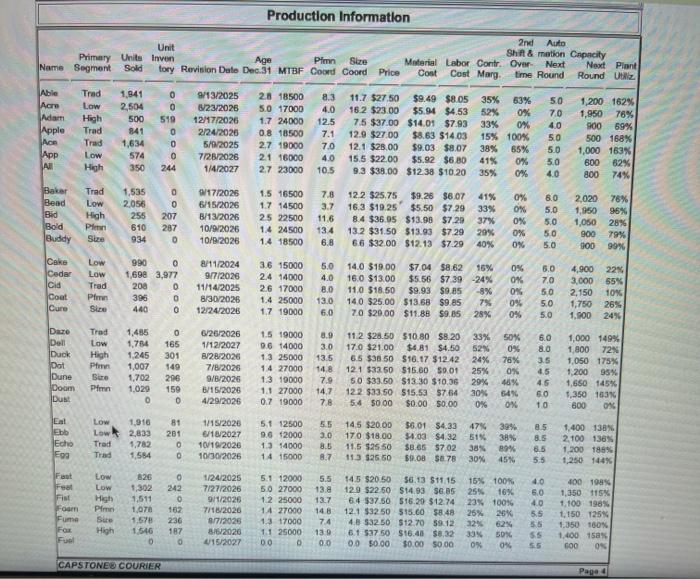
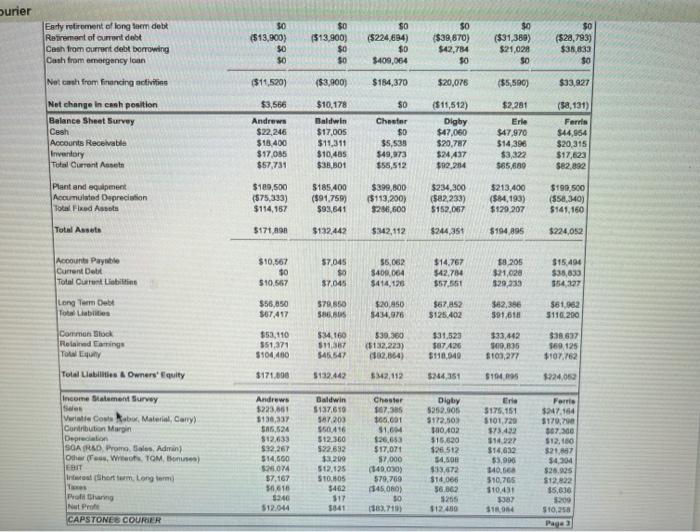
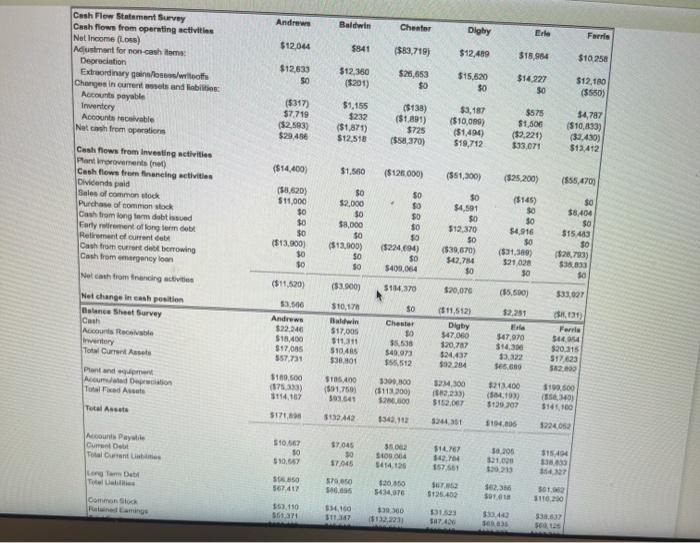
Andrews 5.4% 1.30 7,0% 0.20 Erle 10.8% 0.90 9.7% Ferrie 4.2% 1.10 4.6% 1.6 ROS Asset Turnover ROA Leverage (Assets/Equity) ROE Emergency Loan Sales EBIT Profits Cumulative Profit SG&A /Sales Contrib. Margin 11.5% $0 $223,861,317 $26,074,491 $12,044,072 $34,597,388 14.4% 38.2% Selected Financial Statistics Baldwin Chanter Digby 0.6% 0.0% 4.9% 1.04 1.03 0.6% -24.5% 5.1% 2.9 -3.7 2.1 1.8% -90.2% 10.5% $0 $409,063,759 $0 $137,618,843 $67,384,748 $252,905,038 $12,125,389 ($49,030,126) $33,671,730 $841,088 ($83,719,323) $12,488,656 ($14,006,314) ($157,617,091) $62,838,772 16.4% 25.3% 10.5% 36.6% 2.5% 31.8% 1.9 18.4% $0 $175,151,342 $40,567,876 $18,984,454 $49,039,307 8.4% 41.9% 2.1 9.5% $0 $247,163,806 $28.924,604 $10,257,524 $57,105,892 8.8% 27.3% Percent of Sales C125724 100% S Market Share C125724 30% O Profit O Other O SGA Depr D Var Costs 60% 40% 20% 0% -20% Andrews 20.28 % Baldwin 12.46% Chester 6.1 % Digby 22 91 % Erie 15.86 % Ferris 22.39% Andrews Chester Digby Erie Ferris CAPSTONE COURIER Page 1 Tor Stocks & Bonds Round: 5 December 31, 2026 Company Andrews Baldwin Chester COURIER Stock Market Summary Shares MarketCap Book Value (SM) Per Share 2.873.454 5636 3.219.705 842 514.15 2.004.107 33 Close 556.91 $12.90 51.00 Change 57.77 $9.02 EPS 34.10 30 20 (529.45) Dividend $3.00 S000 $0.09 Yield 5,3% 0.05 0.ON PE 13.6 402 Units Sold vs Demand Chart Market Share 50% 40% 30% 20% 10% 14,000 12,000 10,000 8,000 6,000 4,000 2.000 0 Trad LOW High Pimn Size Industry Unit Sales Total Unit Demand 0% Andrews Baldwin Chester Trad Low High Pimn Size Potential Market Share in Units Trad Low High Pimn 11.471 15,581 5,410 4,726 Industry Unit Sales % of Market Size Total 4,596 41,784 27.4% 37.3% 12.9% 11.3% 11.0% 100.0% 18.2% Able Acre Adam Apple Ace App All Total 14.7% 8.9% 0.1% 3.8% 13.9% 5.0% 5.5% 1.2% 1.1% 3.8% 2.4% 0.8% 19.8% App Actual Market Share in Units Trad Low High Pfmn Size Total 11,359 15.581 5,410 4,726 4,596 41,672 Units Demanded 27.3% 37.4% 13.0% 11.3% 11.0% 100.0% % of Market 17.1% 4.7% 16.1% 6.0% Able 9.2% 1.2% Acre 7.2% 0.1% 2.0% Adam 14.4% 3.9% Apple 3.7% 1.4% 6.5% 0.8% 38.7% 19.9% 15.7% 20.0% All Total 13.1% 0.3% 3.7% 13.2% 4.9% Baker 4.7% 0.6% Bead 12.9% 1.5% Bid 20.3% 2.2% Bold 13.1% 13.5% 4.7% 12.9% 20.3% 12.9% Buddy Total 0.6% 5.9% 2.45 10.9% 4.1% Cake 1.8% 0.0% 0.5% Cedar 8.4% 0.9% Cid 0.5% 8.3% 1.1% Cont 3.0% 16.8% B 9.0% Cure Total 13.0% 0.1% 3,6% 6.4% 62% 35.9% 21,3% 15.1% 11.4% Baker Bead Bid Bold Buddy Total 0.3% 13.7% 4.5% 12.2% 3.2% 5.1% 0.6% 1.4% 2.8% 13.1% 11.4% 14.0% 4.5% 12.2% 25,1% 25.1% 1.1% Cake Cedar Cid Coat Ouro Total 90% 9.3% 3.7% 18.7% 0.1% 3.5% 5.2 1.5% 13.6% 0.4% 20.2% pare 18.4% 13.6% 9.0% 9.2% 1.1% 14.9% Ina Top Products In Low End Segment Units Market Sold to Cust. Revision Stock Pimn Size List Name Share Age Promo Aware- Seg Date Out Coord Coord Price MTBF Dec.31 Budget Ebb 18% ness 2,833 6/18/2027 3.0 17.0 $18.00 12000 9.60 $1,500 88% Acre 16% 2,504 8/23/2026 YES 4.0 16.2 $23.00 17000 4.97 $1,400 100% Bead 13% 2.056 6/15/2026 YES 3.7 16,3 $19.25 14500 1.73 Dell $1,400 100% 11% 1,784 1/12/2027 3.0 17.0 $21.00 14000 9.50 Cedar $1,350 83% 51% 1,698 9/7/2026 4.0 16.0 $13.00 14000 2.35 $1,300 98% Ent 11% 1,659 1/15/2026 5.5 14.5 $20.00 12500 5.09 $1,500 Cake 6% 918 8/11/2024 YES 5.0 14.0 $19.00 15000 3.57 $1,500 100% Fast 5% 794 1/24/2025 YES 5,5 14.5 $20.50 12000 5.08 $500 45% Feat 4% 696 7/27/2026 13.8 12.9 $22.50 27000 5.01 $1,400 80% App 574 7/28/2026 YES 4.0 15.5 $22.00 16000 2.14 $1,800 100% Baker 0% 47 9/17/2026 YES 7.8 122 $25.75 16500 1.50 $1,400 100% Apple 0% 19 2/24/2026 YES 7.1 12.9 $27.00 18500 0.85 $2,800 75% CAPSTONE COURIER 89% Cust. Dec Sales Access Cust Budget ibility Survey $1,056 61% 13 $2,500 91% 20 $2,000 69% 16 $1,556 50% 7 $1,200 37% 40 $1,056 61% 13 $1,300 37% 12 $715 58% 8 $1,287 58% 0 $1,800 91% 13 $2,000 69% 0 $2.000 91% 0 Page 6 Top High End Market Segment Analysis CAPSTONE Round: 5 December 31, 2026 Accessibility C125724 High End High End Statistics Total Industry Unit Demand Actual Industry Unit Sales Segment of Total Industry 5.410 5,410 13.0% Next Year's Segment Growth Rate Andrews Baldwin Chester Digby Erie 16.2% Ferris High End Customer Buying Criteria Expectations Importance 1 ideal Position Pfmn 13.4 Side 6.6 43% 2. Age Ideal Age 0.0 29% 3: Reliability MTBF 20000-25000 19% 4 $27.50 -37.50 0% Perceptual Map for High End Segment Perceptual and of this year Price 0% 20% 40% 50% 80% TOON Actual vs Potential Market Share High End 50% Perceptual Map for All Segments Perceptual map (at end of this year) ize 19 18 17 Pub 16 TE App 14 Cake 1 Coat Belgiant Dog Apple AdBaker Stiae 12 1 10 Bid Adam DUCK 6 Cure Buddy Buse NA 0 4 Perfomance 12 14 16 1820 6 8 10 Neme Able Acre Andrews Pfm 8,3 117 4.0 te 2 75 71 12.0 Chester Site 14.0 Baldwin Pimin Sire 78 122 32 16.3 11.6 84 13.2 6.6 Revised Name 9/12/2025 Baker 123/2026 Band 12/17/2026 Bid 2/24/2026 Bold 2005 Buddy Ravised Name 17/2026 Cake 6/15/2020 Cedar 8/13/2026 Cid 10/9/2026 Coat 1019 2020 Care Pfm 5.0 4.0 80 13.0 Adam 160 Revised B/11/2024 77/2006 11/14/2025 5/30/2026 12/202020 11.0 14.0 7.0 Apple Seg Age Units Market Sold to Name Share Able 17% 1,941 Echo 16% 1,782 Ace 14% 1,634 Egg 14% 1,584 Baker 13% 1,488 Daze 13% 1,481 7% 822 Eat 2% 257 Cid 2% 207 Cake 1% 72 Cure 1% 58 Fast 0% 31 CAPSTONE COURIER Top Products In Traditional Segment Cust Revision Stock Pim Size List Promo Aware- Date Out Coord Coord Price MTBF Dec 31 Budget no 9/13/2025 YES 8.3 11.7 $27.50 18500 2.75 $1,400 100% 10/19/2026 YES 8.5 11.5 $25.50 14000 1.26 $1,500 87% 5/9/2025 YES 7.0 12.1 $28.00 19000 2.69 $1,400 100% 10/30/2026 YES 8.7 113 $25.50 15000 1.43 $1,500 87% 9/17/2026 YES 7.8 122 $25.75 16500 1.50 $1,400 100% 6/26/2026 YES 8.9 112 $28.50 19000 1.51 $1,350 84% 2/24/2026 YES 7.1 12.9 $27.00 18500 0.85 $2,800 75% 1/15/2026 5.5 14.5 $20.00 12500 5.09 $1,500 89% 11/14/2025 YES 8.0 11.0 $18.50 17000 258 $1,300 88% 8/11/2024 YES 5.0 14.0 $19.00 15000 $1,500 100% 12/24/2026 YES 6.0 7.0 $29.00 19000 1.75 $1,300 87% 1/24/2025 YES 5.5 14.5 $20.50 12000 5.08 $500 45% Cunt Sales Access Budget ibility $2,500 98% $1,056 77% $1,800 98% $1,056 77% $2,000 63% $1,556 45% $2,000 98% $1,056 77% $1,300 68% $1,300 68% $1,300 68% $715 18% Apple Dec Cust. Survey 50 33 34 39 39 29 1B 0 59 0 0 0 Page 5 3.57 Top Low End Market Segment Analysis CAPSTONE COURIER Round: 5 December 31, 2026 Accessibility C125724 Low End Low End Statistics Total Industry Unit Demand Actual Industry Unit Sales Segment of Total Industry 15,581 15,581 37.3% Next Year's Segment Growth Rate Andrews Baldwin Chester Digby Erle 11.7% Ferris Low End Customer Buying Criteria Expectations Importance 1. Price $12.50 -22 50 53% 2 Age Ideal Age 70 24% 3 ideal Position Pimn 4.2 Size 15 a 16% 4. Reliability MTBF 12000-17000 7% Perceptual Map for Low End Segment 38 Peroeptual sapat end of this year 0% 20% 40% 60% 80% 100% Actual vs Potentia.Shu 18 Low End 25% 2001 Andrew Baldwin Cheater Digby Erle Farris $12,044 $841 ($83.719 $12,419 $18.964 $10258 Cash Flow Statement Survey Cashflows from operating activities Net Income (L.668) Adjustment for non-cashme Depreciation Extraordinary gains/ wote Changes in curters and liabilis Accounts payable Inwertery Accountable Nets from operations $12,633 50 $12350 (5201) $20,653 $0 $15.620 50 $14.227 $0 $12,100 ($550) $575 ($317) $7,719 (52,593) $29,456 $1,155 $232 ($1.871) $12,518 ($138) ($1.891) $725 (558,370) $3,187 ($10,095) (51,490) $19,712 $1,800 ($2,221) $33.071 $4,787 ($10,833) (32.430) $13,412 ($14.400 $1.500 ($126.000) (561,300) (525.200) ($55,4709 Cash flows from investing activities Pantrovement) Cash flows from financing activities Dividenda paid Sales of common stock Purchase of common stock Cash from long term diebtissued Early moment of long term det Retiremente current Cash from current del borrowing Cashtrommergency loon Netch tromfnancing activities (53.620) $11,000 $0 $0 $0 ($13.300) 30 $0 $0 $2.000 30 $8.000 50 ($13,000) $0 $0 $0 . $0 $0 $0 $0 (5224.600) $0 $400.064 $0 $4,591 $0 $12,370 So (530,670) 542,784 $0 ($145 $0 30 $4,916 $0 ($31,300) $21.028 30 $0 $8.404 $ $15.483 $0 $28,793) s 30 so ($11,520) (3900) $184.370 $20,070 (15.500) 533 027 Nel change in cash position Balance Sheet Survey Cash Account Recible very Total Current $3.56 Andrews $22.240 $18.400 $17.685 $57,730 $10,178 Baldwin $17.00 $11.311 $10.40 30.01 Chester 10 9.538 $40,073 $56.512 3300,000 ($113.300) 5.26.000 ($11,5121 Digby $47.000 120,787 $24.437 $92.294 $2.251 El 347,970 $14.30 3.322 S60 131 Ferra $14054 $20.315 $17.623 52100 Plantando Accuero Total Asset $180.500 (575.333) $114.162 3234.300 $185.400 (891750 3931 $19.500 5213.400 (02.1990 $130107 $12.07 Total Assets $147.100 $17. 032442 1343,112 435 $14.000 1224052 Accounts Payable Current Total Current 510 567 50 $10.647 57045 30 S645 SLO.064 5414.126 315 $14.767 12.04 157.561 30.200 191.000 Long Debt TU 16427 S850 567.417 57050 0.005 $20.000 5434 070 17 $126.400 102.36 Sot Commons 01.02 11020 $52.110 361 1,150 3117 $180 331593 338.632 sos 1. Describe your strategy. Based on round 5, use two products in two different segments to illustrate how you have implemented your strategy. (50 points) ABC 2. Evaluate the implementation of your strategy with these two products. (Have you appropriately implemented your strategy with these products?) (25 points) 3. What should be the competitive advantage of these products? Have you achieved it with these two products? Use relevant evidence to support your claim. (25 points) I Andrews 5.4% 1.30 7,0% 0.20 Erle 10.8% 0.90 9.7% Ferrie 4.2% 1.10 4.6% 1.6 ROS Asset Turnover ROA Leverage (Assets/Equity) ROE Emergency Loan Sales EBIT Profits Cumulative Profit SG&A /Sales Contrib. Margin 11.5% $0 $223,861,317 $26,074,491 $12,044,072 $34,597,388 14.4% 38.2% Selected Financial Statistics Baldwin Chanter Digby 0.6% 0.0% 4.9% 1.04 1.03 0.6% -24.5% 5.1% 2.9 -3.7 2.1 1.8% -90.2% 10.5% $0 $409,063,759 $0 $137,618,843 $67,384,748 $252,905,038 $12,125,389 ($49,030,126) $33,671,730 $841,088 ($83,719,323) $12,488,656 ($14,006,314) ($157,617,091) $62,838,772 16.4% 25.3% 10.5% 36.6% 2.5% 31.8% 1.9 18.4% $0 $175,151,342 $40,567,876 $18,984,454 $49,039,307 8.4% 41.9% 2.1 9.5% $0 $247,163,806 $28.924,604 $10,257,524 $57,105,892 8.8% 27.3% Percent of Sales C125724 100% S Market Share C125724 30% O Profit O Other O SGA Depr D Var Costs 60% 40% 20% 0% -20% Andrews 20.28 % Baldwin 12.46% Chester 6.1 % Digby 22 91 % Erie 15.86 % Ferris 22.39% Andrews Chester Digby Erie Ferris CAPSTONE COURIER Page 1 Tor Stocks & Bonds Round: 5 December 31, 2026 Company Andrews Baldwin Chester COURIER Stock Market Summary Shares MarketCap Book Value (SM) Per Share 2.873.454 5636 3.219.705 842 514.15 2.004.107 33 Close 556.91 $12.90 51.00 Change 57.77 $9.02 EPS 34.10 30 20 (529.45) Dividend $3.00 S000 $0.09 Yield 5,3% 0.05 0.ON PE 13.6 402 Units Sold vs Demand Chart Market Share 50% 40% 30% 20% 10% 14,000 12,000 10,000 8,000 6,000 4,000 2.000 0 Trad LOW High Pimn Size Industry Unit Sales Total Unit Demand 0% Andrews Baldwin Chester Trad Low High Pimn Size Potential Market Share in Units Trad Low High Pimn 11.471 15,581 5,410 4,726 Industry Unit Sales % of Market Size Total 4,596 41,784 27.4% 37.3% 12.9% 11.3% 11.0% 100.0% 18.2% Able Acre Adam Apple Ace App All Total 14.7% 8.9% 0.1% 3.8% 13.9% 5.0% 5.5% 1.2% 1.1% 3.8% 2.4% 0.8% 19.8% App Actual Market Share in Units Trad Low High Pfmn Size Total 11,359 15.581 5,410 4,726 4,596 41,672 Units Demanded 27.3% 37.4% 13.0% 11.3% 11.0% 100.0% % of Market 17.1% 4.7% 16.1% 6.0% Able 9.2% 1.2% Acre 7.2% 0.1% 2.0% Adam 14.4% 3.9% Apple 3.7% 1.4% 6.5% 0.8% 38.7% 19.9% 15.7% 20.0% All Total 13.1% 0.3% 3.7% 13.2% 4.9% Baker 4.7% 0.6% Bead 12.9% 1.5% Bid 20.3% 2.2% Bold 13.1% 13.5% 4.7% 12.9% 20.3% 12.9% Buddy Total 0.6% 5.9% 2.45 10.9% 4.1% Cake 1.8% 0.0% 0.5% Cedar 8.4% 0.9% Cid 0.5% 8.3% 1.1% Cont 3.0% 16.8% B 9.0% Cure Total 13.0% 0.1% 3,6% 6.4% 62% 35.9% 21,3% 15.1% 11.4% Baker Bead Bid Bold Buddy Total 0.3% 13.7% 4.5% 12.2% 3.2% 5.1% 0.6% 1.4% 2.8% 13.1% 11.4% 14.0% 4.5% 12.2% 25,1% 25.1% 1.1% Cake Cedar Cid Coat Ouro Total 90% 9.3% 3.7% 18.7% 0.1% 3.5% 5.2 1.5% 13.6% 0.4% 20.2% pare 18.4% 13.6% 9.0% 9.2% 1.1% 14.9% Ina Top Products In Low End Segment Units Market Sold to Cust. Revision Stock Pimn Size List Name Share Age Promo Aware- Seg Date Out Coord Coord Price MTBF Dec.31 Budget Ebb 18% ness 2,833 6/18/2027 3.0 17.0 $18.00 12000 9.60 $1,500 88% Acre 16% 2,504 8/23/2026 YES 4.0 16.2 $23.00 17000 4.97 $1,400 100% Bead 13% 2.056 6/15/2026 YES 3.7 16,3 $19.25 14500 1.73 Dell $1,400 100% 11% 1,784 1/12/2027 3.0 17.0 $21.00 14000 9.50 Cedar $1,350 83% 51% 1,698 9/7/2026 4.0 16.0 $13.00 14000 2.35 $1,300 98% Ent 11% 1,659 1/15/2026 5.5 14.5 $20.00 12500 5.09 $1,500 Cake 6% 918 8/11/2024 YES 5.0 14.0 $19.00 15000 3.57 $1,500 100% Fast 5% 794 1/24/2025 YES 5,5 14.5 $20.50 12000 5.08 $500 45% Feat 4% 696 7/27/2026 13.8 12.9 $22.50 27000 5.01 $1,400 80% App 574 7/28/2026 YES 4.0 15.5 $22.00 16000 2.14 $1,800 100% Baker 0% 47 9/17/2026 YES 7.8 122 $25.75 16500 1.50 $1,400 100% Apple 0% 19 2/24/2026 YES 7.1 12.9 $27.00 18500 0.85 $2,800 75% CAPSTONE COURIER 89% Cust. Dec Sales Access Cust Budget ibility Survey $1,056 61% 13 $2,500 91% 20 $2,000 69% 16 $1,556 50% 7 $1,200 37% 40 $1,056 61% 13 $1,300 37% 12 $715 58% 8 $1,287 58% 0 $1,800 91% 13 $2,000 69% 0 $2.000 91% 0 Page 6 Top High End Market Segment Analysis CAPSTONE Round: 5 December 31, 2026 Accessibility C125724 High End High End Statistics Total Industry Unit Demand Actual Industry Unit Sales Segment of Total Industry 5.410 5,410 13.0% Next Year's Segment Growth Rate Andrews Baldwin Chester Digby Erie 16.2% Ferris High End Customer Buying Criteria Expectations Importance 1 ideal Position Pfmn 13.4 Side 6.6 43% 2. Age Ideal Age 0.0 29% 3: Reliability MTBF 20000-25000 19% 4 $27.50 -37.50 0% Perceptual Map for High End Segment Perceptual and of this year Price 0% 20% 40% 50% 80% TOON Actual vs Potential Market Share High End 50% Perceptual Map for All Segments Perceptual map (at end of this year) ize 19 18 17 Pub 16 TE App 14 Cake 1 Coat Belgiant Dog Apple AdBaker Stiae 12 1 10 Bid Adam DUCK 6 Cure Buddy Buse NA 0 4 Perfomance 12 14 16 1820 6 8 10 Neme Able Acre Andrews Pfm 8,3 117 4.0 te 2 75 71 12.0 Chester Site 14.0 Baldwin Pimin Sire 78 122 32 16.3 11.6 84 13.2 6.6 Revised Name 9/12/2025 Baker 123/2026 Band 12/17/2026 Bid 2/24/2026 Bold 2005 Buddy Ravised Name 17/2026 Cake 6/15/2020 Cedar 8/13/2026 Cid 10/9/2026 Coat 1019 2020 Care Pfm 5.0 4.0 80 13.0 Adam 160 Revised B/11/2024 77/2006 11/14/2025 5/30/2026 12/202020 11.0 14.0 7.0 Apple Seg Age Units Market Sold to Name Share Able 17% 1,941 Echo 16% 1,782 Ace 14% 1,634 Egg 14% 1,584 Baker 13% 1,488 Daze 13% 1,481 7% 822 Eat 2% 257 Cid 2% 207 Cake 1% 72 Cure 1% 58 Fast 0% 31 CAPSTONE COURIER Top Products In Traditional Segment Cust Revision Stock Pim Size List Promo Aware- Date Out Coord Coord Price MTBF Dec 31 Budget no 9/13/2025 YES 8.3 11.7 $27.50 18500 2.75 $1,400 100% 10/19/2026 YES 8.5 11.5 $25.50 14000 1.26 $1,500 87% 5/9/2025 YES 7.0 12.1 $28.00 19000 2.69 $1,400 100% 10/30/2026 YES 8.7 113 $25.50 15000 1.43 $1,500 87% 9/17/2026 YES 7.8 122 $25.75 16500 1.50 $1,400 100% 6/26/2026 YES 8.9 112 $28.50 19000 1.51 $1,350 84% 2/24/2026 YES 7.1 12.9 $27.00 18500 0.85 $2,800 75% 1/15/2026 5.5 14.5 $20.00 12500 5.09 $1,500 89% 11/14/2025 YES 8.0 11.0 $18.50 17000 258 $1,300 88% 8/11/2024 YES 5.0 14.0 $19.00 15000 $1,500 100% 12/24/2026 YES 6.0 7.0 $29.00 19000 1.75 $1,300 87% 1/24/2025 YES 5.5 14.5 $20.50 12000 5.08 $500 45% Cunt Sales Access Budget ibility $2,500 98% $1,056 77% $1,800 98% $1,056 77% $2,000 63% $1,556 45% $2,000 98% $1,056 77% $1,300 68% $1,300 68% $1,300 68% $715 18% Apple Dec Cust. Survey 50 33 34 39 39 29 1B 0 59 0 0 0 Page 5 3.57 Top Low End Market Segment Analysis CAPSTONE COURIER Round: 5 December 31, 2026 Accessibility C125724 Low End Low End Statistics Total Industry Unit Demand Actual Industry Unit Sales Segment of Total Industry 15,581 15,581 37.3% Next Year's Segment Growth Rate Andrews Baldwin Chester Digby Erle 11.7% Ferris Low End Customer Buying Criteria Expectations Importance 1. Price $12.50 -22 50 53% 2 Age Ideal Age 70 24% 3 ideal Position Pimn 4.2 Size 15 a 16% 4. Reliability MTBF 12000-17000 7% Perceptual Map for Low End Segment 38 Peroeptual sapat end of this year 0% 20% 40% 60% 80% 100% Actual vs Potentia.Shu 18 Low End 25% 2001 Andrew Baldwin Cheater Digby Erle Farris $12,044 $841 ($83.719 $12,419 $18.964 $10258 Cash Flow Statement Survey Cashflows from operating activities Net Income (L.668) Adjustment for non-cashme Depreciation Extraordinary gains/ wote Changes in curters and liabilis Accounts payable Inwertery Accountable Nets from operations $12,633 50 $12350 (5201) $20,653 $0 $15.620 50 $14.227 $0 $12,100 ($550) $575 ($317) $7,719 (52,593) $29,456 $1,155 $232 ($1.871) $12,518 ($138) ($1.891) $725 (558,370) $3,187 ($10,095) (51,490) $19,712 $1,800 ($2,221) $33.071 $4,787 ($10,833) (32.430) $13,412 ($14.400 $1.500 ($126.000) (561,300) (525.200) ($55,4709 Cash flows from investing activities Pantrovement) Cash flows from financing activities Dividenda paid Sales of common stock Purchase of common stock Cash from long term diebtissued Early moment of long term det Retiremente current Cash from current del borrowing Cashtrommergency loon Netch tromfnancing activities (53.620) $11,000 $0 $0 $0 ($13.300) 30 $0 $0 $2.000 30 $8.000 50 ($13,000) $0 $0 $0 . $0 $0 $0 $0 (5224.600) $0 $400.064 $0 $4,591 $0 $12,370 So (530,670) 542,784 $0 ($145 $0 30 $4,916 $0 ($31,300) $21.028 30 $0 $8.404 $ $15.483 $0 $28,793) s 30 so ($11,520) (3900) $184.370 $20,070 (15.500) 533 027 Nel change in cash position Balance Sheet Survey Cash Account Recible very Total Current $3.56 Andrews $22.240 $18.400 $17.685 $57,730 $10,178 Baldwin $17.00 $11.311 $10.40 30.01 Chester 10 9.538 $40,073 $56.512 3300,000 ($113.300) 5.26.000 ($11,5121 Digby $47.000 120,787 $24.437 $92.294 $2.251 El 347,970 $14.30 3.322 S60 131 Ferra $14054 $20.315 $17.623 52100 Plantando Accuero Total Asset $180.500 (575.333) $114.162 3234.300 $185.400 (891750 3931 $19.500 5213.400 (02.1990 $130107 $12.07 Total Assets $147.100 $17. 032442 1343,112 435 $14.000 1224052 Accounts Payable Current Total Current 510 567 50 $10.647 57045 30 S645 SLO.064 5414.126 315 $14.767 12.04 157.561 30.200 191.000 Long Debt TU 16427 S850 567.417 57050 0.005 $20.000 5434 070 17 $126.400 102.36 Sot Commons 01.02 11020 $52.110 361 1,150 3117 $180 331593 338.632 sos 1. Describe your strategy. Based on round 5, use two products in two different segments to illustrate how you have implemented your strategy. (50 points) ABC 2. Evaluate the implementation of your strategy with these two products. (Have you appropriately implemented your strategy with these products?) (25 points) 3. What should be the competitive advantage of these products? Have you achieved it with these two products? Use relevant evidence to support your claim. (25 points)
Step by Step Solution
There are 3 Steps involved in it

Get step-by-step solutions from verified subject matter experts