PLEASE ANSWER QUESTION 1-3
THE TEAM IS CHESTER AND THE PRODUCTS FOR TEAM CHESTER ARE CAKE, CEDAR, CID ,COAT AND LASTLY CURE.
Selected Financial Statistics Andrews Baldwin Chester Digby Erie Ferris ROS 5.4% 0.6% 0.0% 4.9% 10.8% 4.2% Asset Turnover 1.30 1.04 0.20 1.03 0.90 1.10 ROA 7.0% 0.6% -24.5% 5.1% 9.7% 4.6% Leverage (Assets/Equity) 1.6 2.9 -3.7
2.1 1.9 2.1 ROE 11.5% 1.8% -90.2% 10.5% 18.4% 9.5% Emergency Loan $0 $0 $409,063,759 $0 $0 $0 Sales $223,861,317 $137,618,843 $67,384,748 $252,905,038 $175,151,342 $247,163,806 EBIT $26,074,491 $12,125,389 ($49,030,126) $33,671,730 $40,567,876 $28,924,604 Profits $12,044,072 $841,088 ($83,719,323) $12,488,656 $18,984,454 $10,257,524 Cumulative Profit $34,597,388 ($14,006,314) ($157,617,091) $62,838,772 $49,039,307 $57,105,892 SG&A / Sales 14.4% 16.4% 25.3% 10.5% 8.4% 8.8% Contrib. Margin % 38.2% 36.6% 2.5% 31.8% 41.9% 27.3% Percent of Sales Bar Chart Market Share Pie Chart CAPSTONE COURIER Page 1 Top Stocks & Bonds CAPSTONE COURIER Round: 5 December 31
, 2026 Stock Market Summary Company Close Change Shares MarketCap ($M) Book Value Per Share EPS Dividend Yield P/E Andrews $56.91 $7.77 2,873,454 $164 $36.36 $4.19 $3.00 5.3% 13.6 Baldwin $12.90 $9.02 3,219,705 $42 $14.15 $0.26 $0.00 0.0% 49.2 Chester $1.00 $0.00 2,804,107 $3 ($33.12) ($29.86) $0.00 0.0% 0.0 Digby $85.64 $8.81 2,204,648 $189 $53.95 $5.66 $0.00 0.0% 15.1 Erie $73.69 $24.14 2,359,597 $174 $43.77 $8.05 $0.06 0.1% 9.2 Ferris $71.88 $6.09 2,339,191 $168 $46.07 $4.39 $0.00 0.0% 16.4 Closing Stock Price Chart Bond Market Summary Company Series# Face Yield Close$ S&P Andrews 14.0S2027 $20,850,000 13.8% 101.24 BBB 11.3S2032 $16,000,000 11.9% 94.75 BBB 12.2S2035 $20,000,000 12.5% 97.92 BBB Baldwin 14.0S2027 $20,850,000 14.1% 98.96 C 12.7S2034 $36,000,000 14.3% 88.86 C 14.2S2035 $15,000,000 14.9% 95.26 C 14.8S2036 $8,000,000 15.1% 98.01 C Chester 14.0S2027 $20,850,000 14.2% 98.45 DDD Digby 14.0S2027 $20,850,000 14.0% 100.09 B 11.4S2033 $4,904,447 12.8% 89.25 B 12.4S2034 $7,653,074 13.3% 93.02 B 12.9S2035 $22,073,731 13.6% 95.04 B 13.4S2036 $12,370,275 13.8% 97.38 B Erie 14.0S2027 $20,850,000 13.9% 100.53 B 11.6S2033 $4,440,554 12.6% 92.14 B 12.5S2034 $7,331,389 13.1% 95.74 B 12.8S2035 $24,847,496 13.2% 96.97 B 13.6S2036 $4,916,108 13.5% 101.07 B Ferris 14.0S2027 $20,850,000 14.0% 100.00 CCC 11.4S2033 $273,718 12.8% 88.85 CCC 12.4S2034 $8,460,612 13.4% 92.58 CCC 13.0S2035 $16,894,875 13.7% 95.05 CCC 13.2S2036 $15,483,112 13.8% 95.83 CCC Next Year's Prime Rate 9.50% CAPSTONE COURIER Page 2 Top Financial Summary CAPSTONE COURIER Round: 5 December 31
, 2026 Cash Flow Statement Survey Andrews Baldwin Chester Digby Erie Ferris Cash flows from operating activities Net Income (Loss) $12,044 $841 ($83,719) $12,489 $18,984 $10,258 Adjustment for non-cash items: Depreciation $12,633 $12,360 $26,653 $15,620 $14,227 $12,180 Extraordinary gains/losses/writeoffs $0 ($201) $0 $0 $0 ($550) Changes in current assets and liabilities: Accounts payable ($317) $1,155 ($138) $3,187 $575 $4,787 Inventory $7,719 $232 ($1,891) ($10,089) $1,506 ($10,833) Accounts receivable ($2,593) ($1,871) $725 ($1,494) ($2,221) ($2,430) Net cash from operations $29,486 $12,518 ($58,370) $19,712 $33,071 $13,412 Cash flows from investing activities Plant improvements (net) ($14,400) $1,560 ($126,000) ($51,300) ($25,200) ($55,470) Cash flows from financing activities Dividends paid ($8,620) $0 $0 $0 ($145) $0 Sales of common stock $11,000 $2,000 $0 $4,591 $0 $8,404 Purchase of common stock $0 $0 $0 $0 $0 $0 Cash from long term debt issued $0 $8,000 $0 $12,370 $4,916 $15,483 Early retirement of long term debt $0 $0 $0 $0 $0 $0 Retirement of current debt ($13,900) ($13,900) ($224,694) ($39,670) ($31,389) ($28,793) Cash from current debt borrowing $0 $0 $0 $42,784 $21,028 $38,833 Cash from emergency loan $0 $0 $409,064 $0 $0 $0 Net cash from financing activities ($11,520) ($3,900) $184,370 $20,076 ($5,590) $33,927 Net change in cash position $3,566 $10,178 $0 ($11,512) $2,281 ($8,131) Balance Sheet Survey Andrews Baldwin Chester Digby Erie Ferris Cash $22,246 $17,005 $0 $47,060 $47,970 $44,954 Accounts Receivable $18,400 $11,311 $5,538 $20,787 $14,396 $20,315 Inventory $17,085 $10,485 $49,973 $24,437 $3,322 $17,623 Total Current Assets $57,731 $38,801 $55,512 $92,284 $65,689 $82,892 Plant and equipment $189,500 $185,400 $399,800 $234,300 $213,400 $199,500 Accumulated Depreciation ($75,333) ($91,759) ($113,200) ($82,233) ($84,193) ($58,340) Total Fixed Assets $114,167 $93,641 $286,600 $152,067 $129,207 $141,160 Total Assets $171,898 $132,442 $342,112 $244,351 $194,895 $224,052 Accounts Payable $10,567 $7,045 $5,062 $14,767 $8,205 $15,494 Current Debt $0 $0 $409,064 $42,784 $21,028 $38,833 Total Current Liabilities $10,567 $7,045 $414,126 $57,551 $29,233 $54,327 Long Term Debt $56,850 $79,850 $20,850 $67,852 $62,386 $61,962 Total Liabilities $67,417 $86,895 $434,976 $125,402 $91,618 $116,290 Common Stock $53,110 $34,160 $39,360 $31,523 $33,442 $38,637 Retained Earnings $51,371 $11,387 ($132,223) $87,426 $69,835 $69,125 Total Equity $104,480 $45,547 ($92,864) $118,949 $103,277 $107,762 Total Liabilities & Owners' Equity $171,898 $132,442 $342,112 $244,351 $194,895 $224,052 Income Statement Survey Andrews Baldwin Chester Digby Erie Ferris Sales $223,861 $137,619 $67,385 $252,905 $175,151 $247,164 Variable Costs (Labor, Material, Carry) $138,337 $87,203 $65,691 $172,503 $101,729 $179,798 Contribution Margin $85,524 $50,416 $1,694 $80,402 $73,422 $67,366 Depreciation $12,633 $12,360 $26,653 $15,620 $14,227 $12,180 SGA (R&D, Promo, Sales, Admin) $32,267 $22,632 $17,071 $26,512 $14,632 $21,867 Other (Fees, Writeoffs, TQM, Bonuses) $14,550 $3,299 $7,000 $4,598 $3,996 $4,394 EBIT $26,074 $12,125 ($49,030) $33,672 $40,568 $28,925 Interest (Short term, Long term) $7,167 $10,805 $79,769 $14,066 $10,765 $12,822 Taxes $6,618 $462 ($45,080) $6,862 $10,431 $5,636 Profit Sharing $246 $17 $0 $255 $387 $209 Net Profit $12,044 $841 ($83,719) $12,489 $18,984 $10,258 CAPSTONE COURIER Page 3 Top Production Analysis CAPSTONE COURIER Round: 5 December 31
, 2026 Production vs Capacity Chart Production Information Name Primary Segment Units Sold Unit Inven tory Revision Date Age Dec.31
MTBF Pfmn Coord Size Coord Price Material Cost Labor Cost Contr. Marg. 2nd Shift & Over- time Auto mation Next Round Capacity Next Round Plant Utiliz. Able Trad 1,941 0 9/13/2025
2.8 18500 8.3 11.7 $27.50 $9.49 $8.05 35% 63% 5.0 1,200 162% Acre Low 2,504 0 8/23/2026
5.0 17000 4.0 16.2 $23.00 $5.94 $4.53 52% 0% 7.0 1,950 76% Adam High 500 519 12
/17/2026 1.7 24000 12.5 7.5 $37.00 $14.01 $7.93 33% 0% 4.0 900 69% Apple Trad 841 0 2/24/2026 0.8 18500 7.1 12.9 $27.00 $8.63 $14.03 15% 100% 5.0 500 168% Ace Trad 1,634 0 5/9/2025
2.7 19000 7.0 12.1 $28.00 $9.03 $8.07 38% 65% 5.0 1,000 163% App Low 574 0 7/28/2026 2.1 16000 4.0 15.5 $22.00 $5.92 $6.80 41% 0% 5.0 600 62% All High 350 244 1/4
/2027 2.7 23000 10.5 9.3 $38.00 $12.38 $10.20 35% 0% 4.0 800 74% Baker Trad 1,535 0 9/17/2026
1.5 16500 7.8 12.2 $25.75 $9.26 $6.07 41% 0% 6.0 2,020 76% Bead Low 2,056 0 6/15/2026
1.7 14500 3.7 16.3 $19.25 $5.50 $7.29 33% 0% 5.0 1,950 96% Bid High 255 207 8/13
/2026 2.5 22500 11.6 8.4 $36.95 $13.98 $7.29 37% 0% 5.0 1,050 28% Bold Pfmn 610 287 10
/9/2026 1.4 24500 13.4 13.2 $31.50 $13.93 $7.29 29% 0% 5.0 900 79% Buddy Size 934 0 10/9/2026 1.4 18500 6.8 6.6 $32.00 $12.13 $7.29 40% 0% 5.0 900 99% Cake Low 990 0 8/11/2024 3.6 15000 5.0 14.0 $19.00 $7.04 $8.62 16% 0% 6.0 4,900 22% Cedar Low 1,698 3,977 9/7/2026
2.4 14000 4.0 16.0 $13.00 $5.56 $7.39 -24% 0% 7.0 3,000 65% Cid Trad 208 0 11/14
/2025 2.6 17000 8.0 11.0 $18.50 $9.93 $9.85 -8% 0% 5.0 2,150 10% Coat Pfmn 396 0 8/30/2026 1.4 25000 13.0 14.0 $25.00 $13.68 $9.85 7% 0% 5.0 1,750 26% Cure Size 440 0 12/24
/2026 1.7 19000 6.0 7.0 $29.00 $11.88 $9.85 28% 0% 5.0 1,900 24% Daze Trad 1,485 0 6/26/2026
1.5 19000 8.9 11.2 $28.50 $10.80 $8.20 33% 50% 6.0 1,000 149% Dell Low 1,784 165 1/12/2027 9.6 14000 3.0 17.0 $21.00 $4.81 $4.50 52% 0% 8.0 1,800 72% Duck High 1,245 301 8/28/2026 1.3 25000 13.5 6.5 $38.50 $16.17 $12.42 24% 76% 3.5 1,050 175% Dot Pfmn 1,007 149 7/8/2026 1.4 27000 14.8 12.1 $33.50 $15.60 $9.01 25% 0% 4.5 1,200 95% Dune Size 1,702 296 9/8/2026 1.3 19000 7.9 5.0 $33.50 $13.30 $10.36 29% 46% 4.5 1,650 145% Doom Pfmn 1,029 159 8/15/2026 1.1 27000 14.7 12.2 $33.50 $15.53 $7.64 30% 64% 6.0 1,350 163% Dust 0 0 4/29/2026
0.7 19000 7.8 5.4 $0.00 $0.00 $0.00 0% 0% 1.0 600 0% Eat Low 1,916 81 1/15/2026 5.1 12500 5.5 14.5 $20.00 $6.01 $4.33 47% 39% 8.5 1,400 138% Ebb Low 2,833 281 6/18/2027 9.6 12000 3.0 17.0 $18.00 $4.03 $4.32 51% 38% 8.5 2,100 136% Echo Trad 1,782 0 10/19/2026 1.3 14000 8.5 11.5 $25.50 $8.65 $7.02 38% 89% 6.5 1,200 188% Egg Trad 1,584 0 10/30/2026 1.4 15000 8.7 11.3 $25.50 $9.08 $8.78 30% 45% 5.5 1,250 144% Fast Low 826 0 1/24/2025 5.1 12000 5.5 14.5 $20.50 $6.13 $11.15 15% 100% 4.0 400 198% Feat Low 1,302 242 7/27/2026 5.0 27000 13.8 12.9 $22.50 $14.93 $6.85 25% 16% 6.0 1,350 115% Fist High 1,511 0 9/1/2026
1.2 25000 13.7 6.4 $37.50 $16.29 $12.74 23% 100% 4.0 1,100 198% Foam Pfmn 1,078 162 7/18/2026 1.4 27000 14.8 12.1 $32.50 $15.60 $8.48 25% 26% 5.5 1,150 125% Fume Size 1,578 236 8/7/2026 1.3 17000 7.4 4.8 $32.50 $12.70 $9.12 32% 62% 5.5 1,350 160% Fox High 1,546 187 8/6/2026 1.1 25000 13.9 6.1 $37.50 $16.48 $8.32 33% 59% 5.5 1,400 158% Fuel 0 0 4/15/2027
0.0 0 0.0 0.0 $0.00 $0.00 $0.00 0% 0% 5.5 600 0% CAPSTONE COURIER Page 4 Top Traditional Market Segment Analysis CAPSTONE COURIER Round: 5 December 31
, 2026 Traditional Statistics Total Industry Unit Demand 11,471 Actual Industry Unit Sales 11,359 Segment % of Total Industry 27.5% Next Year's Segment Growth Rate 9.2% Traditional Customer Buying Criteria Expectations Importance 1. Age Ideal Age = 2.0 47% 2. Price $17.50 - 27.50 23% 3. Ideal Position Pfmn 8.5 Size 11.5 21% 4. Reliability MTBF 14000-19000
9% Accessibility Chart Perceptual Map for Traditional Segment Perceptual Map for Traditional Actual vs Potential Market Share Chart Top Products in Traditional Segment Name Market Share Units Sold to Seg Revision Date Stock Out Pfmn Coord Size Coord List Price MTBF Age Dec.31
Promo Budget Cust. Aware- ness Sales Budget Cust. Access- ibility Dec. Cust. Survey Able 17% 1,941 9/13/2025
YES 8.3 11.7 $27.50 18500 2.75 $1,400 100% $2,500 98% 50 Echo 16% 1,782 10/19/2026
YES 8.5 11.5 $25.50 14000 1.26 $1,500 87% $1,056 77% 33 Ace 14% 1,634 5/9/2025
YES 7.0 12.1 $28.00 19000 2.69 $1,400 100% $1,800 98% 34 Egg 14% 1,584 10/30/2026
YES 8.7 11.3 $25.50 15000 1.43 $1,500 87% $1,056 77% 39 Baker 13% 1,488 9/17/2026
YES 7.8 12.2 $25.75 16500 1.50 $1,400 100% $2,000 63% 39 Daze 13% 1,481 6/26/2026
YES 8.9 11.2 $28.50 19000 1.51 $1,350 84% $1,556 45% 29 Apple 7% 822 2/24/2026 YES 7.1 12.9 $27.00 18500 0.85 $2,800 75% $2,000 98% 18 Eat 2% 257 1/15/2026 5.5 14.5 $20.00 12500 5.09 $1,500 89% $1,056 77% 0 Cid 2% 207 11/14/2025 YES 8.0 11.0 $18.50 17000 2.58 $1,300 88% $1,300 68% 59 Cake 1% 72 8/11/2024
YES 5.0 14.0 $19.00 15000 3.57 $1,500 100% $1,300 68% 0 Cure 1% 58 12/24/2026 YES 6.0 7.0 $29.00 19000 1.75 $1,300 87% $1,300 68% 0 Fast 0% 31 1/24/2025
YES 5.5 14.5 $20.50 12000 5.08 $500 45% $715 18% 0 CAPSTONE COURIER Page 5 Top Low End Market Segment Analysis CAPSTONE COURIER Round: 5 December 31
, 2026 Low End Statistics Total Industry Unit Demand 15,581 Actual Industry Unit Sales 15,581 Segment % of Total Industry 37.3% Next Year's Segment Growth Rate 11.7% Low End Customer Buying Criteria Expectations Importance 1. Price $12.50 - 22.50 53% 2. Age Ideal Age = 7.0 24% 3. Ideal Position Pfmn 4.2 Size 15.8 16% 4. Reliability MTBF 12000-17000
7% Accessibility Chart Perceptual Map for Low End Segment Perceptual Map for Low End Actual vs Potential Market Share Chart Top Products in Low End Segment Name Market Share Units Sold to Seg Revision Date Stock Out Pfmn Coord Size Coord List Price MTBF Age Dec.31
Promo Budget Cust. Aware- ness Sales Budget Cust. Access- ibility Dec. Cust. Survey Ebb 18% 2,833 6/18/2027
3.0 17.0 $18.00 12000 9.60 $1,500 88% $1,056 61% 13 Acre 16% 2,504 8/23/2026
YES 4.0 16.2 $23.00 17000 4.97 $1,400 100% $2,500 91% 20 Bead 13% 2,056 6/15/2026
YES 3.7 16.3 $19.25 14500 1.73 $1,400 100% $2,000 69% 16 Dell 11% 1,784 1/12/2027
3.0 17.0 $21.00 14000 9.60 $1,350 83% $1,556 50% 7 Cedar 11% 1,698 9/7/2026
4.0 16.0 $13.00 14000 2.35 $1,300 98% $1,200 37% 40 Eat 11% 1,659 1/15/2026
5.5 14.5 $20.00 12500 5.09 $1,500 89% $1,056 61% 13 Cake 6% 918 8/11/2024 YES 5.0 14.0 $19.00 15000 3.57 $1,500 100% $1,300 37% 12 Fast 5% 794 1/24/2025 YES 5.5 14.5 $20.50 12000 5.08 $500 45% $715 58% 8 Feat 4% 696 7/27/2026 13.8 12.9 $22.50 27000 5.01 $1,400 80% $1,287 58% 0 App 4% 574 7/28/2026 YES 4.0 15.5 $22.00 16000 2.14 $1,800 100% $1,800 91% 13 Baker 0% 47 9/17/2026
YES 7.8 12.2 $25.75 16500 1.50 $1,400 100% $2,000 69% 0 Apple 0% 19 2/24/2026
YES 7.1 12.9 $27.00 18500 0.85 $2,800 75% $2,000 91% 0 CAPSTONE COURIER Page 6 Top High End Market Segment Analysis CAPSTONE COURIER Round: 5 December 31
, 2026 High End Statistics Total Industry Unit Demand 5,410 Actual Industry Unit Sales 5,410 Segment % of Total Industry 13.0% Next Year's Segment Growth Rate 16.2% High End Customer Buying Criteria Expectations Importance 1. Ideal Position Pfmn 13.4 Size 6.6 43% 2. Age Ideal Age = 0.0 29% 3. Reliability MTBF 20000-25000
19% 4. Price $27.50 - 37.50 9% Accessibility Chart Perceptual Map for High End Segment Perceptual Map for High End Actual vs Potential Market Share Chart Top Products in High End Segment Name Market Share Units Sold to Seg Revision Date Stock Out Pfmn Coord Size Coord List Price MTBF Age Dec.31
Promo Budget Cust. Aware- ness Sales Budget Cust. Access- ibility Dec. Cust. Survey Fox 29% 1,546 8/6/2026
13.9 6.1 $37.50 25000 1.14 $1,450 74% $1,287 73% 44 Fist 28% 1,511 9/1/2026
YES 13.7 6.4 $37.50 25000 1.24 $1,450 85% $1,287 73% 55 Duck 23% 1,245 8/28/2026
13.5 6.5 $38.50 25000 1.25 $1,375 84% $1,653 47% 38 Adam 9% 500 12/17/2026 12.5 7.5 $37.00 24000 1.68 $1,400 100% $1,800 92% 45 All 6% 350 1/4/2027 10.5 9.3 $38.00 23000 2.73 $1,400 100% $2,000 92% 7 Bid 5% 255 8/13/2026 11.6 8.4 $36.95 22500 2.48 $1,400 98% $2,000 54% 10 Daze 0% 4 6/26/2026
YES 8.9 11.2 $28.50 19000 1.51 $1,350 84% $1,556 47% 0 CAPSTONE COURIER Page 7 Top Performance Market Segment Analysis CAPSTONE COURIER Round: 5 December 31
, 2026 Performance Statistics Total Industry Unit Demand 4,726 Actual Industry Unit Sales 4,726 Segment % of Total Industry 11.3% Next Year's Segment Growth Rate 19.8% Performance Customer Buying Criteria Expectations Importance 1. Reliability MTBF 22000-27000
43% 2. Ideal Position Pfmn 14.4 Size 12.5 29% 3. Price $22.50 - 32.50 19% 4. Age Ideal Age = 1.0 9% Accessibility Chart Perceptual Map for Performance Segment Perceptual Map for Performance Actual vs Potential Market Share Chart Top Products in Performance Segment Name Market Share Units Sold to Seg Revision Date Stock Out Pfmn Coord Size Coord List Price MTBF Age Dec.31
Promo Budget Cust. Aware- ness Sales Budget Cust. Access- ibility Dec. Cust. Survey Foam 23% 1,078 7/18/2026
14.8 12.1 $32.50 27000 1.41 $1,400 83% $1,287 36% 42 Doom 22% 1,029 8/15/2026
14.7 12.2 $33.50 27000 1.14 $1,350 74% $1,653 57% 39 Dot 21% 1,007 7/8/2026
14.8 12.1 $33.50 27000 1.44 $1,350 82% $1,653 57% 39 Bold 13% 610 10/9/2026 13.4 13.2 $31.50 24500 1.38 $1,400 97% $2,000 54% 27 Feat 13% 606 7/27/2026 13.8 12.9 $22.50 27000 5.01 $1,400 80% $1,287 36% 51 Coat 8% 396 8/30/2026 YES 13.0 14.0 $25.00 25000 1.39 $1,300 87% $1,300 36% 29 CAPSTONE COURIER Page 8 Top Size Market Segment Analysis CAPSTONE COURIER Round: 5 December 31
, 2026 Size Statistics Total Industry Unit Demand 4,596 Actual Industry Unit Sales 4,596 Segment % of Total Industry 11.0% Next Year's Segment Growth Rate 18.3% Size Customer Buying Criteria Expectations Importance 1. Ideal Position Pfmn 7.5 Size 5.6 43% 2. Age Ideal Age = 1.5 29% 3. Reliability MTBF 16000-21000
19% 4. Price $22.50 - 32.50 9% Accessibility Chart Perceptual Map for Size Segment Perceptual Map for Size Actual vs Potential Market Share Chart Top Products in Size Segment Name Market Share Units Sold to Seg Revision Date Stock Out Pfmn Coord Size Coord List Price MTBF Age Dec.31
Promo Budget Cust. Aware- ness Sales Budget Cust. Access- ibility Dec. Cust. Survey Dune 37% 1,702 9/8/2026
7.9 5.0 $33.50 19000 1.33 $1,350 82% $1,653 42% 31 Fume 34% 1,578 8/7/2026
7.4 4.8 $32.50 17000 1.33 $1,400 83% $1,287 37% 29 Buddy 20% 934 10/9/2026 YES 6.8 6.6 $32.00 18500 1.37 $1,400 100% $2,000 52% 31 Cure 8% 381 12/24/2026 YES 6.0 7.0 $29.00 19000 1.75 $1,300 87% $1,300 37% 19 CAPSTONE COURIER Page 9 Top Market Share Report CAPSTONE COURIER Round: 5 December 31
, 2026 Units Sold vs Demand Chart Market Share by Segment Chart Actual Market Share in Units Trad Low High Pfmn Size Total Industry Unit Sales 11,359 15,581 5,410 4,726 4,596 41,672 % of Market 27.3% 37.4% 13.0% 11.3% 11.0% 100.0% Able 17.1% 4.7% Acre 16.1% 6.0% Adam 9.2% 1.2% Apple 7.2% 0.1% 2.0% Ace 14.4% 3.9% App 3.7% 1.4% All 6.5% 0.8% Total 38.7% 19.9% 15.7% 20.0% Baker 13.1% 0.3% 3.7% Bead 13.2% 4.9% Bid 4.7% 0.6% Bold 12.9% 1.5% Buddy 20.3% 2.2% Total 13.1% 13.5% 4.7% 12.9% 20.3% 12.9% Cake 0.6% 5.9% 2.4% Cedar 10.9% 4.1% Cid 1.8% 0.0% 0.5% Coat 8.4% 0.9% Cure 0.5% 8.3% 1.1% Total 3.0% 16.8% 8.4% 8.3% 9.0% Daze 13.0% 0.1% 3.6% Dell 11.4% 4.3% Duck 23.0% 3.0% Dot 21.3% 2.4% Dune 37.0% 4.1% Doom 21.8% 2.5% Total 13.0% 11.4% 23.1% 43.1% 37.0% 19.8% Eat 2.3% 10.6% 4.6% Ebb 18.2% 6.8% Echo 15.7% 4.3% Egg 13.9% 3.8% Total 31.9% 28.8% 19.5% Fast 0.3% 5.1% 2.0% Feat 4.5% 12.8% 3.1% Fist 27.9% 3.6% Foam 22.8% 2.6% Fume 34.3% 3.8% Fox 28.6% 3.7% Total 0.3% 9.6% 56.5% 35.6% 34.3% 18.8% Potential Market Share in Units Trad Low High Pfmn Size Total Units Demanded 11,471 15,581 5,410 4,726 4,596 41,784 % of Market 27.4% 37.3% 12.9% 11.3% 11.0% 100.0% Able 18.2% 5.0% Acre 14.7% 5.5% Adam 8.9% 1.2% Apple 3.8% 0.1% 1.1% Ace 13.9% 3.8% App 6.4% 2.4% All 6.2% 0.8% Total 35.9% 21.3% 15.1% 19.8% Baker 11.4% 0.3% 3.2% Bead 13.7% 5.1% Bid 4.5% 0.6% Bold 12.2% 1.4% Buddy 25.1% 2.8% Total 11.4% 14.0% 4.5% 12.2% 25.1% 13.1% Cake 1.1% 9.0% 3.7% Cedar 9.3% 3.5% Cid 18.7% 0.1% 5.2% Coat 13.6% 1.5% Cure 0.4% 9.0% 1.1% Total 20.2% 18.4% 13.6% 9.2% 14.9% Daze 7.8% 0.1% 2.1% Dell 9.9% 3.7% Duck 21.9% 2.8% Dot 20.0% 2.3% Dune 34.1% 3.8% Doom 20.5% 2.3% Total 7.8% 9.9% 22.0% 40.5% 34.1% 17.0% Eat 0.2% 9.2% 3.5% Ebb 17.1% 6.4% Echo 11.6% 3.2% Egg 12.8% 3.5% Total 24.6% 26.4% 16.6% Fast 0.1% 6.0% 2.2% Feat 4.2% 12.2% 2.9% Fist 30.8% 4.0% Foam 21.5% 2.4% Fume 31.6% 3.5% Fox 27.6% 3.6% Total 0.1% 10.1% 58.4% 33.7% 31.6% 18.6% CAPSTONE COURIER Page 10 Top Perceptual Map CAPSTONE COURIER Round: 5 December 31
, 2026 Perceptual Map for All Segments Perceptual Map for All Segments Andrews Name Pfmn Size Revised Able 8.3 11.7 9/13/2025
Acre 4.0 16.2 8/23/2026
Adam 12.5 7.5 12/17/2026
Apple 7.1 12.9 2/24/2026
Ace 7.0 12.1 5/9/2025
App 4.0 15.5 7/28/2026
All 10.5 9.3 1/4/2027
Baldwin Name Pfmn Size Revised Baker 7.8 12.2 9/17/2026
Bead 3.7 16.3 6/15/2026
Bid 11.6 8.4 8/13/2026
Bold 13.4 13.2 10/9/2026
Buddy 6.8 6.6 10/9/2026
Chester Name Pfmn Size Revised Cake 5.0 14.0 8/11/2024
Cedar 4.0 16.0 9/7/2026
Cid 8.0 11.0 11/14/2025
Coat 13.0 14.0 8/30/2026
Cure 6.0 7.0 12/24/2026
Digby Name Pfmn Size Revised Daze 8.9 11.2 6/26/2026
Dell 3.0 17.0 1/12/2027
Duck 13.5 6.5 8/28/2026
Dot 14.8 12.1 7/8/2026
Dune 7.9 5.0 9/8/2026
Doom 14.7 12.2 8/15/2026
Dust 7.8 5.4 4/29/2026
Erie Name Pfmn Size Revised Eat 5.5 14.5 1/15/2026
Ebb 3.0 17.0 6/18/2027
Echo 8.5 11.5 10/19/2026
Egg 8.7 11.3 10/30/2026
Ferris Name Pfmn Size Revised Fast 5.5 14.5 1/24/2025
Feat 13.8 12.9 7/27/2026
Fist 13.7 6.4 9/1/2026
Foam 14.8 12.1 7/18/2026
Fume 7.4 4.8 8/7/2026
Fox 13.9 6.1 8/6/2026
CAPSTONE COURIER Page 11 Top HR/TQM Report CAPSTONE COURIER Round: 5 December 31
, 2026 HUMAN RESOURCES SUMMARY Andrews Baldwin Chester Digby Erie Ferris Needed Complement 1,010 679 605 1,198
729 1,204 Complement 1,010 679 605 1,198
729 1,204 1st Shift Complement 744 679 605 863 483
768 2nd Shift Complement 266 0 0 335 246 436
Overtime% 0.0% 0.0% 0.0% 0.0% 0.0% 0.0% Turnover Rate 6.5% 7.6% 7.7% 8.6% 8.9% 8.5% New Employees 66 133 47 312 65
328 Separated Employees 34 0 47 0 3 0
Recruiting Spend $5,000 $3,800 $3,000 $2,200 $2,000 $2,500 Training Hours 80 50 60 30 25 30
Productivity Index 116.3% 114.1% 107.0% 105.7% 103.6% 106.0% Recruiting Cost $397 $638 $186 $998 $194 $1,148 Separation Cost $170 $0 $235 $0 $13 $0 Training Cost $1,616 $679 $726 $719 $365 $722 Total HR Admin Cost $2,183 $1,317 $1,147 $1,717 $571 $1,870 Labor Contract Next Year Wages $26.81 $26.81 $26.81 $26.81 $26.81 $26.81 Benefits 2,500 2,500 2,500 2,500 2,500 2,500 Profit Sharing 2.0% 2.0% 2.0% 2.0% 2.0% 2.0% Annual Raise 5.0% 5.0% 5.0% 5.0% 5.0% 5.0% Starting Negotiation Position Wages Benefits Profit Sharing Annual Raise Ceiling Negotiation Position Wages Benefits Profit Sharing Annual Raise Adjusted Labor Demands Wages Benefits Profit Sharing Annual Raise Strike Days TQM SUMMARY Andrews Baldwin Chester Digby Erie Ferris Process Mgt Budgets Last Year CPI Systems $1,500 $0 $0 $0 $750 $0 Vendor/JIT $2,000 $1,000 $1,000 $0 $750 $0 Quality Initiative Training $0 $0 $2,000 $0 $750 $0 Channel Support Systems $1,500 $1,000 $2,000 $750 $0 $750 Concurrent Engineering $1,500 $0 $0 $750 $0 $750 UNEP Green Programs $1,500 $0 $0 $0 $750 $0 TQM Budgets Last Year Benchmarking $1,500 $0 $0 $750 $0 $750 Quality Function Deployment Effort $1,500 $1,000 $0 $750 $0 $750 CCE/6 Sigma Training $1,500 $0 $2,000 $750 $0 $750 GEMI TQEM Sustainability Initiatives $1,500 $0 $0 $0 $750 $0 Total Expenditures $14,000 $3,000 $7,000 $3,750 $3,750 $3,750 Cumulative Impacts Material Cost Reduction 7.37% 0.03% 0.37% 0.14% 4.44% 0.14% Labor Cost Reduction 6.68% 0.00% 7.17% 0.58% 3.99% 0.58% Reduction R&D Cycle Time 37.72% 0.96% 12.58% 32.16% 0.00% 32.16% Reduction Admin Costs 53.43% 1.59% 1.59% 28.68% 6.50% 28.68% Demand Increase 11.52% 0.97% 5.91% 4.28% 0.63% 4.28% 
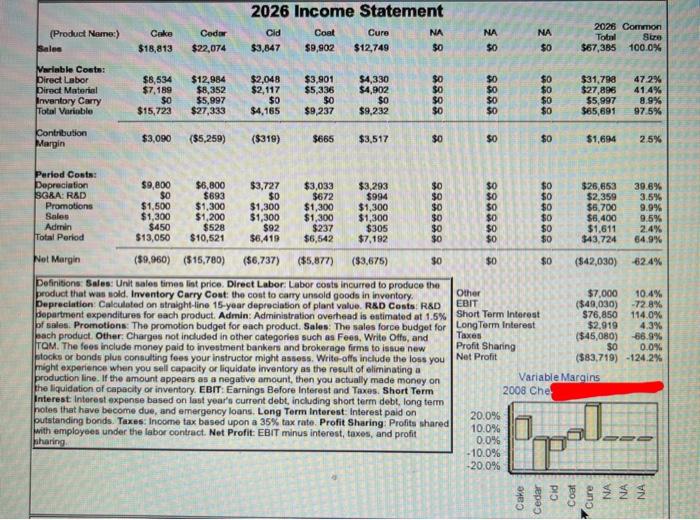
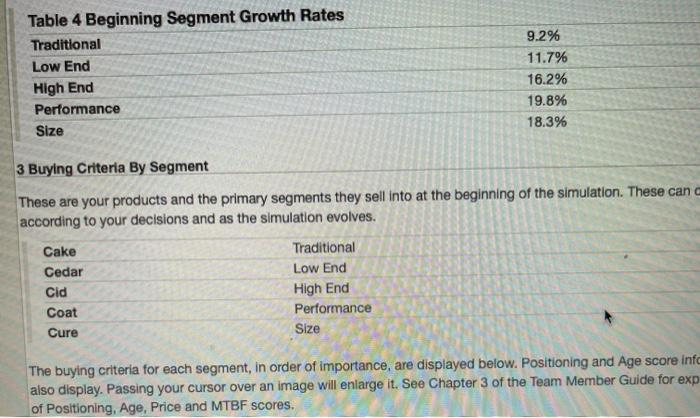
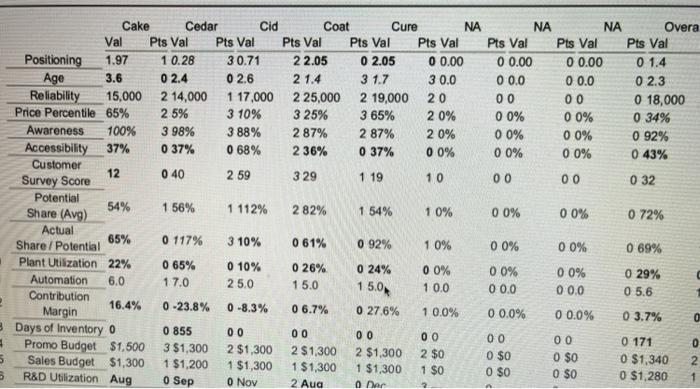
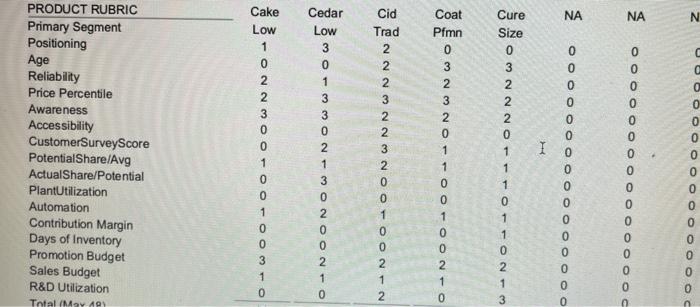
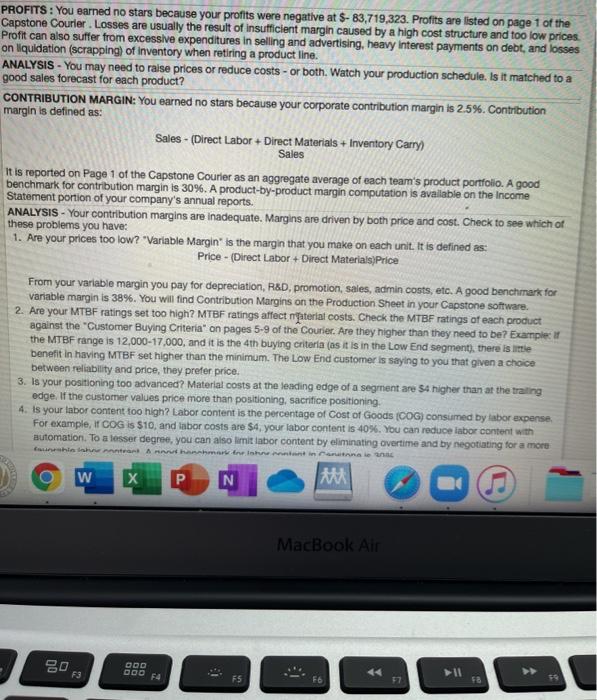
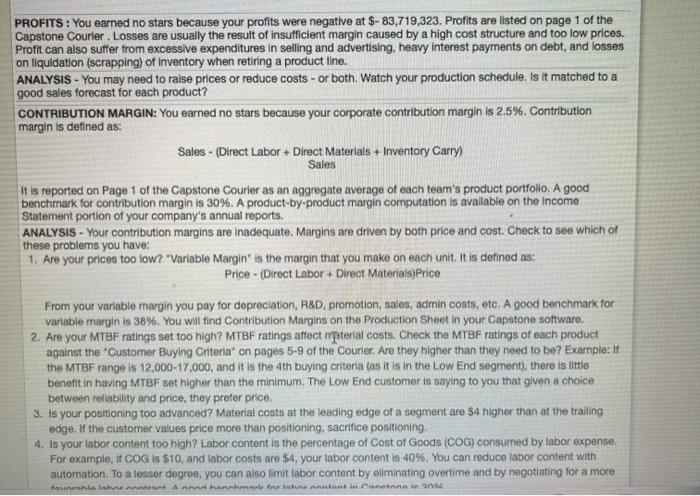
1. Describe your strategy. Based on round 5, use two products in two different segments to illustrate how you have implemented your strategy. (50 points) 2. Evaluate the implementation of your strategy with these two products. (Have you appropriately implemented your strategy with these products?) (25 points) 3. What should be the competitive advantage of these products? Have you achieved it with these two products? Use relevant evidence to support your claim. (25 points) (Product Name:) Sales Cid 2026 Income Statement Coat Cure NA $3,847 $9,902 $12,749 50 Cake $18,813 Codor $22,074 NA $0 NA $0 2028 Common Totul Size $67,385 100.0% Mariable Costs: Direct Labor Direct Material Inventory Carry Total Variable $8,534 $7,189 SO $15,723 $12,984 $8,352 $5,997 $27,333 $2,048 $2,117 $0 $4,165 $3,901 $5,336 $0 $9,237 $4,330 $4,902 $0 $9,232 88888 $0 $0 $o $0 $0 $0 $0 $0 $31,798 $27,896 $5,997 $65,691 472% 41.4% 8.9% 97.5% Contribution Margin $3,090 ($5,259) ($319) $665 $3,517 $0 $0 $1,694 25% Period Costs: Depreciation $9,800 $6,800 $3,727 $3,033 $3,293 $0 $0 $0 $26,653 39.6% SG&A: RAD $0 $693 $0 $672 $994 $0 $0 $0 $2,359 3.5% Promotions $1,500 $1,300 $1,300 $1,300 $1,300 $0 $0 $0 $6,700 9.9% Sales $1,300 $1,200 $1,300 $1,300 $1,300 $0 $0 $0 $6,400 9.5% Admin $450 $528 $92 $237 $305 $0 $0 $0 $1.611 2.4% Total Period $13,050 $10,521 $6,419 $6,542 $7,192 $0 $0 $43,724 64.9% Net Margin ($9.960) ($15,780) ($6.737) ($5,877) ($3,675) $0 $0 $0 ($42,030) 62.4% Definitions Sales: Unit sales times list price Direct Labor: Labor costs incurred to produce the product that was sold. Inventory Carry Cost: the cost to carry unsold goods in inventory Other $7,000 10.4% Depreciation Calculated on straight-line 15-year depreciation of plant value. R&D Costs: R&D EDIT ($49,030) -72.8% pepartment expenditures for each product. Admin: Administration overhead is estimated at 1.5% Short Term Interest $76,850 114.0% prsales Promotions. The promotion budget for each product. Sales: The sales force budget for Long Term Interest $2.919 4.3% pach product Other Charges not included in other categories such as Fees, Write Offs, and Taxes ($45,080) 56.9% TOM. The fees include money paid to investment bankers and brokerage firms to issue new Profit Sharing $0 0.0% blocks or bonds plus consulting foes your instructor might assess. Write-offs include the loss you Net Profit (583,719) -1242% might experience when you sell capacity or liquidate inventory as the result of eliminating a production line. If the amount appears as a negative amount, then you actually made money on Variable Margins the liquidation of capacity or inventory EBIT. Earnings Before Interest and Taxes. Short Term 2008 Che Interest Interest expense based on last year's current debt, including short term debt, long term notes that have become due, and emergency loans. Long Term Interest: Interest paid on putstanding bonds. Taxes: Income tax based upon a 35% tax rate. Profit Sharing: Profits shared 20.0% with employees under the labor contract. Net Profit: EBIT minus interest, taxes, and profit 10.0% sharing 0.0% -10.0% -20.0% Cake Cedar Cid Coat Cure Table 4 Beginning Segment Growth Rates Traditional Low End High End Performance Size 9.2% 11.7% 16.2% 19.8% 18.3% 3 Buying Criteria By Segment These are your products and the primary segments they sell into at the beginning of the simulation. These canc according to your decisions and as the simulation evolves. Cake Cedar Cid Coat Cure Traditional Low End High End Performance Size The buying criteria for each segment, in order of importance, are displayed below. Positioning and Age score info also display. Passing your cursor over an image will enlarge it. See Chapter 3 of the Team Member Guide for exp of Positioning, Age, Price and MTBF scores. NA NA N Cake Low 1 Coat Pfmn Cure Size Cedar Low 3 0 1 2 2 3 NOWW-OW PRODUCT RUBRIC Primary Segment Positioning Age Reliability Price Percentile Awareness Accessibility Customer SurveyScore PotentialShare/Avg ActualShare/Potential PlantUtilization Automation Contribution Margin Days of Inventory Promotion Budget Sales Budget R&D Utilization Total (May 19 Cid Trad 2 2 2 3 2 2 3 2 ONNNWO T 1 3 O NOOOOONWNWO 0 1 0 0 1 0 0 3 1 1 1 1 U O NOONO -NOO 0 0 0 0 0 1 3 0 0 PROFITS : You earned no stars because your profits were negative at $- 83,719,323. Profits are listed on page 1 of the Capstone Courier. Losses are usually the result of insufficient margin caused by a high cost structure and too low prices. Profit can also suffer from excessive expenditures in selling and advertising, heavy interest payments on debt, and losses on liquidation (scrapping) of inventory when retiring a product line. ANALYSIS - You may need to raise prices or reduce costs - or both. Watch your production schedule. Is it matched to a good sales forecast for each product? CONTRIBUTION MARGIN: You earned no stars because your corporate contribution margin is 2.5%. Contribution margin is defined as: Sales - (Direct Labor + Direct Materials + Inventory Carry) Sales It is reported on Page 1 of the Capstone Courier as an aggregate average of each team's product portfolio. A good benchmark for contribution margin is 30%. A product-by-product margin computation is available on the Income Statement portion of your company's annual reports. ANALYSIS - Your contribution margins are inadequate. Margins are driven by both price and cost. Check to see which of these problems you have: 1. Are your prices too low? "Variable Margin" is the margin that you make on each unit. It is defined as: Price - Direct Labor + Direct Materials]Price From your variable margin you pay for depreciation, R&D, promotion, sales, admin costs, etc. A good benchmark for variable margin is 38%. You will find Contribution Margins on the Production Sheet in your Capstone software. 2. Are your MTBF ratings set too high? MTBF ratings affect naterial costs. Check the MTBF ratings of each product against the Customer Buying Criteria" on pages 5-9 of the Courier. Are they higher than they need to be? Example the MTBF range is 12.000-17,000, and it is the 4th buying criteria (as it is in the Low End segment), there is little benefit in having MTBF set higher than the minimum. The Low End customer is saying to you that given a choice between reliability and price, they prefer price. 3. Is your positioning too advanced? Material costs at the leading edge of a segment are 54 higher than at the trailing edge. If the customer values price more than positioning, sacrifice positioning 4. Is your labor content too high? Labor content is the percentage of Cost of Goods (COG) consumed by labor expense, For example, I COG is $10, and labor costs are $4, your labor content is 40%. You can reduce labor content with autor dion. To a lesser degree, you can also limitlabor content by eliminating overtime and by negotiating for a more tushinnat Arut hannmarine intentant in cartona w N M MacBook Air 00 ODO F3 GOD F4 > F5 F6 7 PROFITS : You earned no stars because your profits were negative at $- 83,719,323. Profits are listed on page 1 of the Capstone Courier. Losses are usually the result of insufficient margin caused by a high cost structure and too low prices. Profit can also suffer from excessive expenditures in seling and advertising, heavy interest payments on debt, and losses on liquidation (scrapping) of inventory when retiring a product line. ANALYSIS - You may need to raise prices or reduce costs - or both. Watch your production schedule. Is it matched to a good sales forecast for each product? CONTRIBUTION MARGIN: You earned no stars because your corporate contribution margin is 2.5%. Contribution margin is defined as: Sales - (Direct Labor + Direct Materials + Inventory Carry) Sales It is reported on Page 1 of the Capstone Courier as an aggregate average of each team's product portfolio. A good benchmark for contribution margin is 30%. A product-by-product margin computation is available on the income Statement portion of your company's annual reports. ANALYSIS - Your contribution margins are inadequate. Margins are driven by both price and cost. Check to see which of these problems you have: 1. Are your prices too low? "Variable Margin' is the margin that you make on each unit. It is defined as: Price - Direct Labor + Direct Materials)Price From your variable margin you pay for dopreciation, R&D, promotion, sales, admin costs, etc. A good benchmark for variable margin is 38%. You will find Contribution Margins on the Production Sheet in your Capstone softwaro. 2. Are your MTBF ratings set too high? MTBF ratings affect paterial costs. Check the MTBF ratings of each product against the Customer Buying Criteria on pages 5-9 of the Courier, Are they higher than they need to be? Example: It the MTBF range is 12,000-17,000, and it is the 4th buying criteria (as it is in the Low End segment), there is little benefit in having MTBF set higher than the minimum. The Low End customer is saying to you that given a choice between reliability and price, they prefer price, 3. Is your positioning too advanced? Material costs at the leading edge of a segment are $4 higher than at the trailing edge. If the customer values price more than positioning, sacrifice positioning 4. Is your labor content too high? Labor content is the percentage of Cost of Goods (COG) consumed by labor expense. For example, if COG is $10, and labor costs are $4, your labor content is 40%. You can reduce labor content with automation. To a lesser degree, you can also limit fabor content by eliminating overtime and by negotiating for a more foulish And harmlehnstantin Pontann le no 1. Describe your strategy. Based on round 5, use two products in two different segments to illustrate how you have implemented your strategy. (50 points) 2. Evaluate the implementation of your strategy with these two products. (Have you appropriately implemented your strategy with these products?) (25 points) 3. What should be the competitive advantage of these products? Have you achieved it with these two products? Use relevant evidence to support your claim. (25 points) (Product Name:) Sales Cid 2026 Income Statement Coat Cure NA $3,847 $9,902 $12,749 50 Cake $18,813 Codor $22,074 NA $0 NA $0 2028 Common Totul Size $67,385 100.0% Mariable Costs: Direct Labor Direct Material Inventory Carry Total Variable $8,534 $7,189 SO $15,723 $12,984 $8,352 $5,997 $27,333 $2,048 $2,117 $0 $4,165 $3,901 $5,336 $0 $9,237 $4,330 $4,902 $0 $9,232 88888 $0 $0 $o $0 $0 $0 $0 $0 $31,798 $27,896 $5,997 $65,691 472% 41.4% 8.9% 97.5% Contribution Margin $3,090 ($5,259) ($319) $665 $3,517 $0 $0 $1,694 25% Period Costs: Depreciation $9,800 $6,800 $3,727 $3,033 $3,293 $0 $0 $0 $26,653 39.6% SG&A: RAD $0 $693 $0 $672 $994 $0 $0 $0 $2,359 3.5% Promotions $1,500 $1,300 $1,300 $1,300 $1,300 $0 $0 $0 $6,700 9.9% Sales $1,300 $1,200 $1,300 $1,300 $1,300 $0 $0 $0 $6,400 9.5% Admin $450 $528 $92 $237 $305 $0 $0 $0 $1.611 2.4% Total Period $13,050 $10,521 $6,419 $6,542 $7,192 $0 $0 $43,724 64.9% Net Margin ($9.960) ($15,780) ($6.737) ($5,877) ($3,675) $0 $0 $0 ($42,030) 62.4% Definitions Sales: Unit sales times list price Direct Labor: Labor costs incurred to produce the product that was sold. Inventory Carry Cost: the cost to carry unsold goods in inventory Other $7,000 10.4% Depreciation Calculated on straight-line 15-year depreciation of plant value. R&D Costs: R&D EDIT ($49,030) -72.8% pepartment expenditures for each product. Admin: Administration overhead is estimated at 1.5% Short Term Interest $76,850 114.0% prsales Promotions. The promotion budget for each product. Sales: The sales force budget for Long Term Interest $2.919 4.3% pach product Other Charges not included in other categories such as Fees, Write Offs, and Taxes ($45,080) 56.9% TOM. The fees include money paid to investment bankers and brokerage firms to issue new Profit Sharing $0 0.0% blocks or bonds plus consulting foes your instructor might assess. Write-offs include the loss you Net Profit (583,719) -1242% might experience when you sell capacity or liquidate inventory as the result of eliminating a production line. If the amount appears as a negative amount, then you actually made money on Variable Margins the liquidation of capacity or inventory EBIT. Earnings Before Interest and Taxes. Short Term 2008 Che Interest Interest expense based on last year's current debt, including short term debt, long term notes that have become due, and emergency loans. Long Term Interest: Interest paid on putstanding bonds. Taxes: Income tax based upon a 35% tax rate. Profit Sharing: Profits shared 20.0% with employees under the labor contract. Net Profit: EBIT minus interest, taxes, and profit 10.0% sharing 0.0% -10.0% -20.0% Cake Cedar Cid Coat Cure Table 4 Beginning Segment Growth Rates Traditional Low End High End Performance Size 9.2% 11.7% 16.2% 19.8% 18.3% 3 Buying Criteria By Segment These are your products and the primary segments they sell into at the beginning of the simulation. These canc according to your decisions and as the simulation evolves. Cake Cedar Cid Coat Cure Traditional Low End High End Performance Size The buying criteria for each segment, in order of importance, are displayed below. Positioning and Age score info also display. Passing your cursor over an image will enlarge it. See Chapter 3 of the Team Member Guide for exp of Positioning, Age, Price and MTBF scores. NA NA N Cake Low 1 Coat Pfmn Cure Size Cedar Low 3 0 1 2 2 3 NOWW-OW PRODUCT RUBRIC Primary Segment Positioning Age Reliability Price Percentile Awareness Accessibility Customer SurveyScore PotentialShare/Avg ActualShare/Potential PlantUtilization Automation Contribution Margin Days of Inventory Promotion Budget Sales Budget R&D Utilization Total (May 19 Cid Trad 2 2 2 3 2 2 3 2 ONNNWO T 1 3 O NOOOOONWNWO 0 1 0 0 1 0 0 3 1 1 1 1 U O NOONO -NOO 0 0 0 0 0 1 3 0 0 PROFITS : You earned no stars because your profits were negative at $- 83,719,323. Profits are listed on page 1 of the Capstone Courier. Losses are usually the result of insufficient margin caused by a high cost structure and too low prices. Profit can also suffer from excessive expenditures in selling and advertising, heavy interest payments on debt, and losses on liquidation (scrapping) of inventory when retiring a product line. ANALYSIS - You may need to raise prices or reduce costs - or both. Watch your production schedule. Is it matched to a good sales forecast for each product? CONTRIBUTION MARGIN: You earned no stars because your corporate contribution margin is 2.5%. Contribution margin is defined as: Sales - (Direct Labor + Direct Materials + Inventory Carry) Sales It is reported on Page 1 of the Capstone Courier as an aggregate average of each team's product portfolio. A good benchmark for contribution margin is 30%. A product-by-product margin computation is available on the Income Statement portion of your company's annual reports. ANALYSIS - Your contribution margins are inadequate. Margins are driven by both price and cost. Check to see which of these problems you have: 1. Are your prices too low? "Variable Margin" is the margin that you make on each unit. It is defined as: Price - Direct Labor + Direct Materials]Price From your variable margin you pay for depreciation, R&D, promotion, sales, admin costs, etc. A good benchmark for variable margin is 38%. You will find Contribution Margins on the Production Sheet in your Capstone software. 2. Are your MTBF ratings set too high? MTBF ratings affect naterial costs. Check the MTBF ratings of each product against the Customer Buying Criteria" on pages 5-9 of the Courier. Are they higher than they need to be? Example the MTBF range is 12.000-17,000, and it is the 4th buying criteria (as it is in the Low End segment), there is little benefit in having MTBF set higher than the minimum. The Low End customer is saying to you that given a choice between reliability and price, they prefer price. 3. Is your positioning too advanced? Material costs at the leading edge of a segment are 54 higher than at the trailing edge. If the customer values price more than positioning, sacrifice positioning 4. Is your labor content too high? Labor content is the percentage of Cost of Goods (COG) consumed by labor expense, For example, I COG is $10, and labor costs are $4, your labor content is 40%. You can reduce labor content with autor dion. To a lesser degree, you can also limitlabor content by eliminating overtime and by negotiating for a more tushinnat Arut hannmarine intentant in cartona w N M MacBook Air 00 ODO F3 GOD F4 > F5 F6 7 PROFITS : You earned no stars because your profits were negative at $- 83,719,323. Profits are listed on page 1 of the Capstone Courier. Losses are usually the result of insufficient margin caused by a high cost structure and too low prices. Profit can also suffer from excessive expenditures in seling and advertising, heavy interest payments on debt, and losses on liquidation (scrapping) of inventory when retiring a product line. ANALYSIS - You may need to raise prices or reduce costs - or both. Watch your production schedule. Is it matched to a good sales forecast for each product? CONTRIBUTION MARGIN: You earned no stars because your corporate contribution margin is 2.5%. Contribution margin is defined as: Sales - (Direct Labor + Direct Materials + Inventory Carry) Sales It is reported on Page 1 of the Capstone Courier as an aggregate average of each team's product portfolio. A good benchmark for contribution margin is 30%. A product-by-product margin computation is available on the income Statement portion of your company's annual reports. ANALYSIS - Your contribution margins are inadequate. Margins are driven by both price and cost. Check to see which of these problems you have: 1. Are your prices too low? "Variable Margin' is the margin that you make on each unit. It is defined as: Price - Direct Labor + Direct Materials)Price From your variable margin you pay for dopreciation, R&D, promotion, sales, admin costs, etc. A good benchmark for variable margin is 38%. You will find Contribution Margins on the Production Sheet in your Capstone softwaro. 2. Are your MTBF ratings set too high? MTBF ratings affect paterial costs. Check the MTBF ratings of each product against the Customer Buying Criteria on pages 5-9 of the Courier, Are they higher than they need to be? Example: It the MTBF range is 12,000-17,000, and it is the 4th buying criteria (as it is in the Low End segment), there is little benefit in having MTBF set higher than the minimum. The Low End customer is saying to you that given a choice between reliability and price, they prefer price, 3. Is your positioning too advanced? Material costs at the leading edge of a segment are $4 higher than at the trailing edge. If the customer values price more than positioning, sacrifice positioning 4. Is your labor content too high? Labor content is the percentage of Cost of Goods (COG) consumed by labor expense. For example, if COG is $10, and labor costs are $4, your labor content is 40%. You can reduce labor content with automation. To a lesser degree, you can also limit fabor content by eliminating overtime and by negotiating for a more foulish And harmlehnstantin Pontann le no