

Question: Please answer question 1-4 step by step and some explanation 1. 1.2 Residual plots to check conditions. For which of the following conditions for inference

Please answer question 1-4 step by step and some explanation
1.
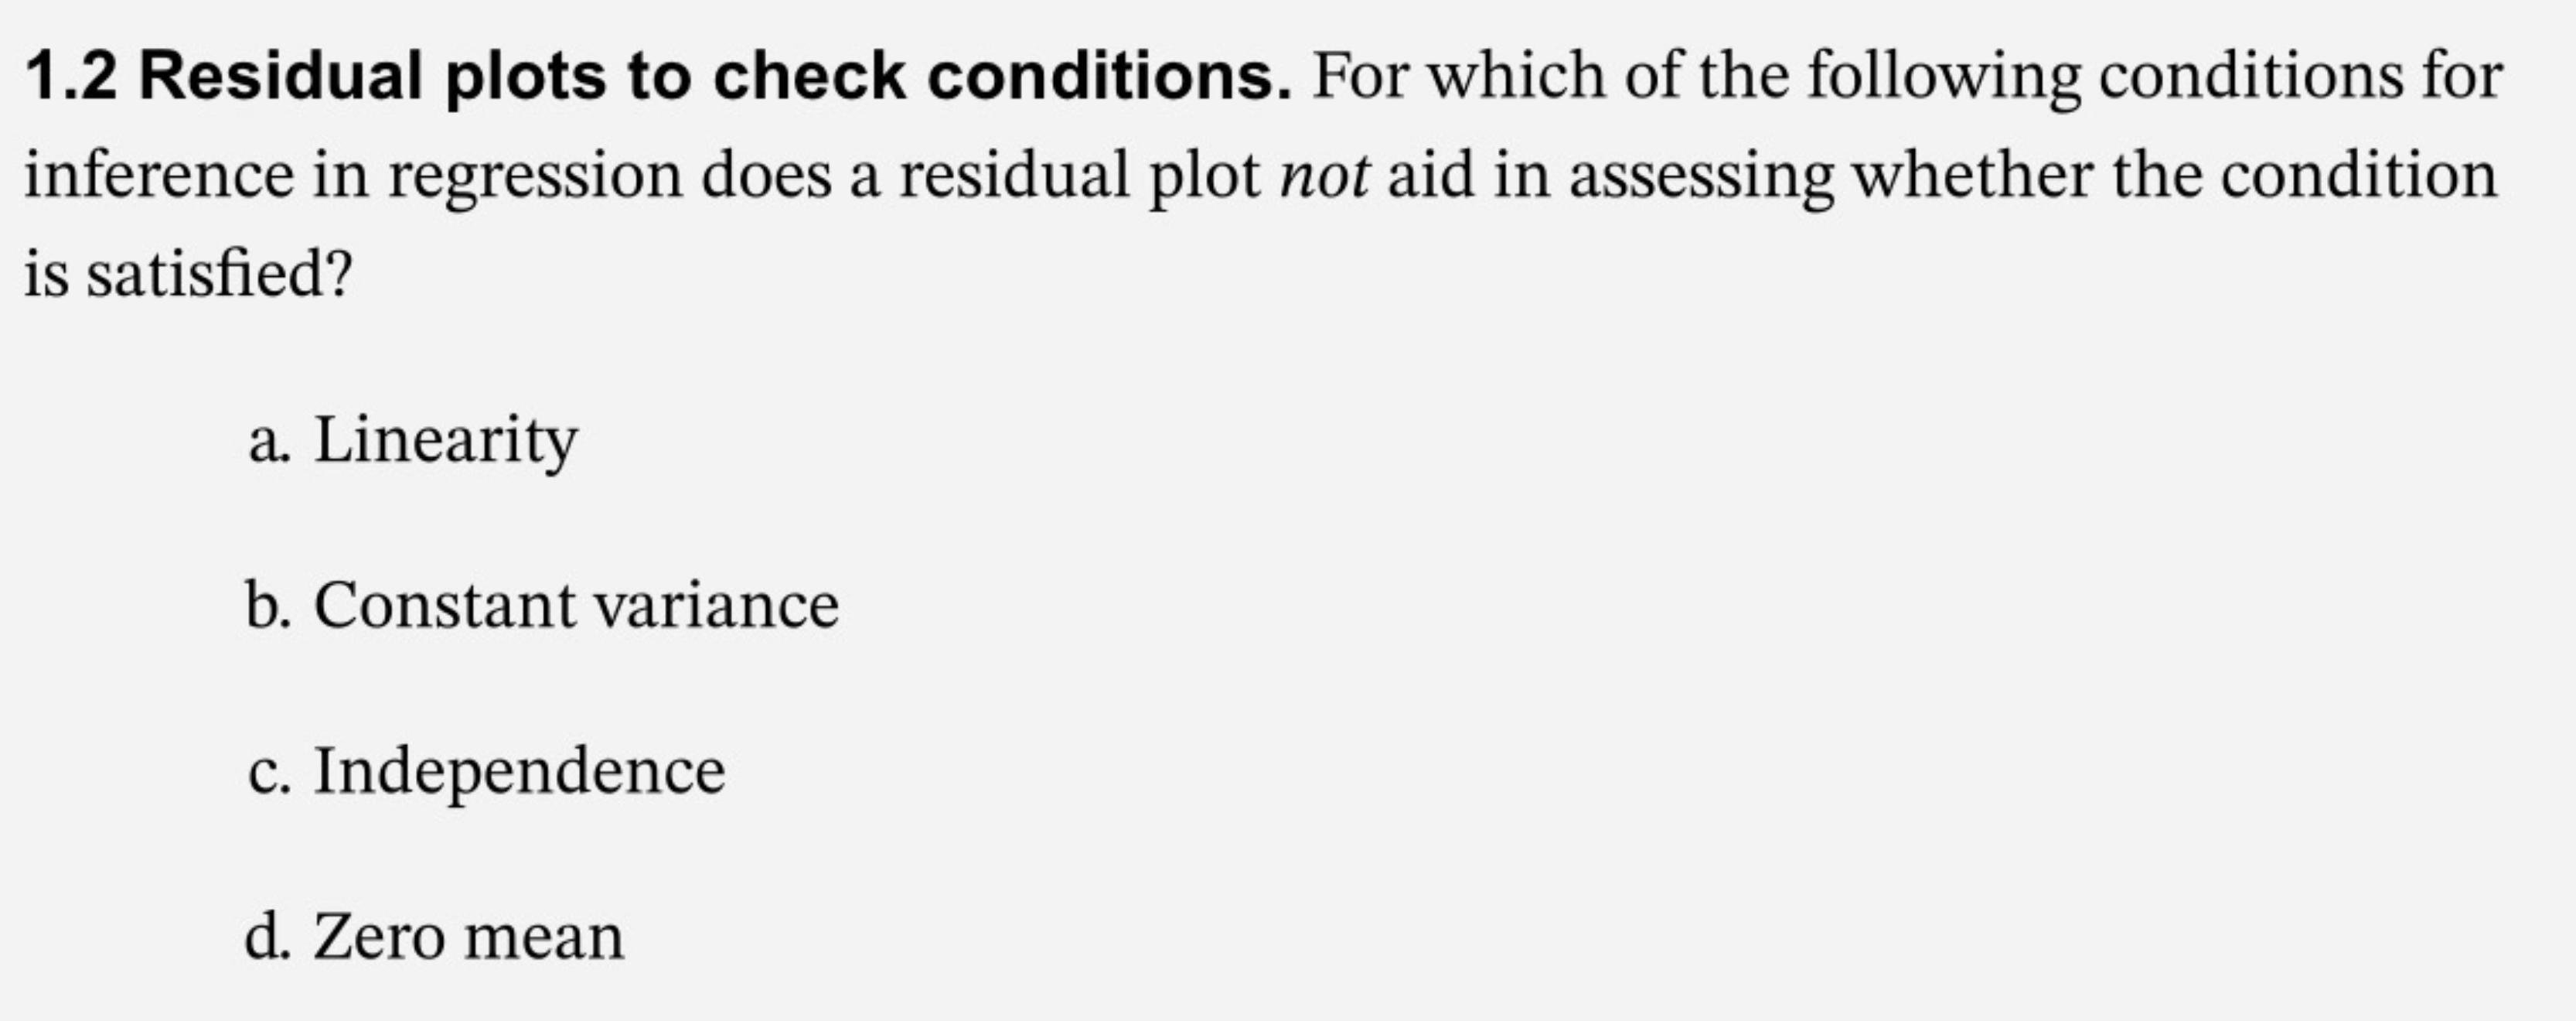
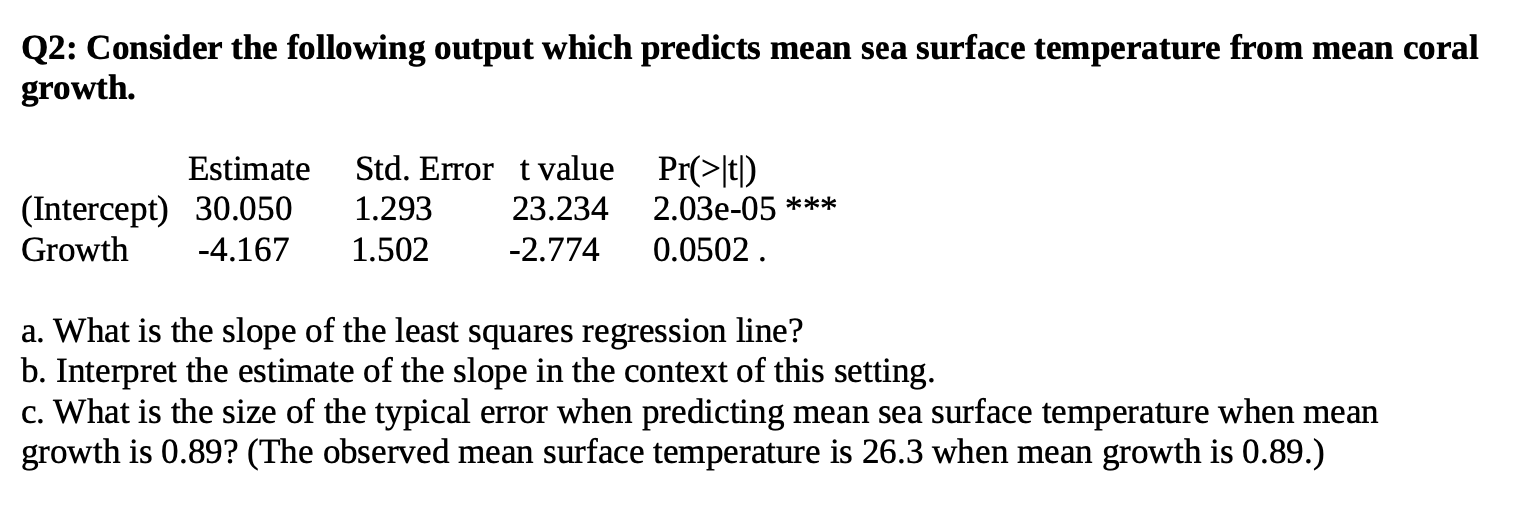
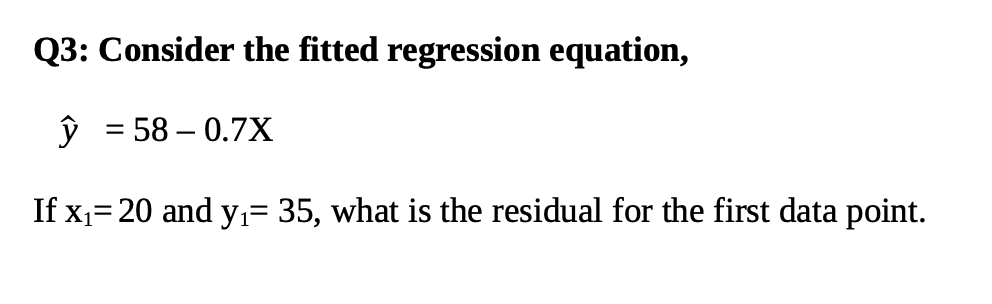

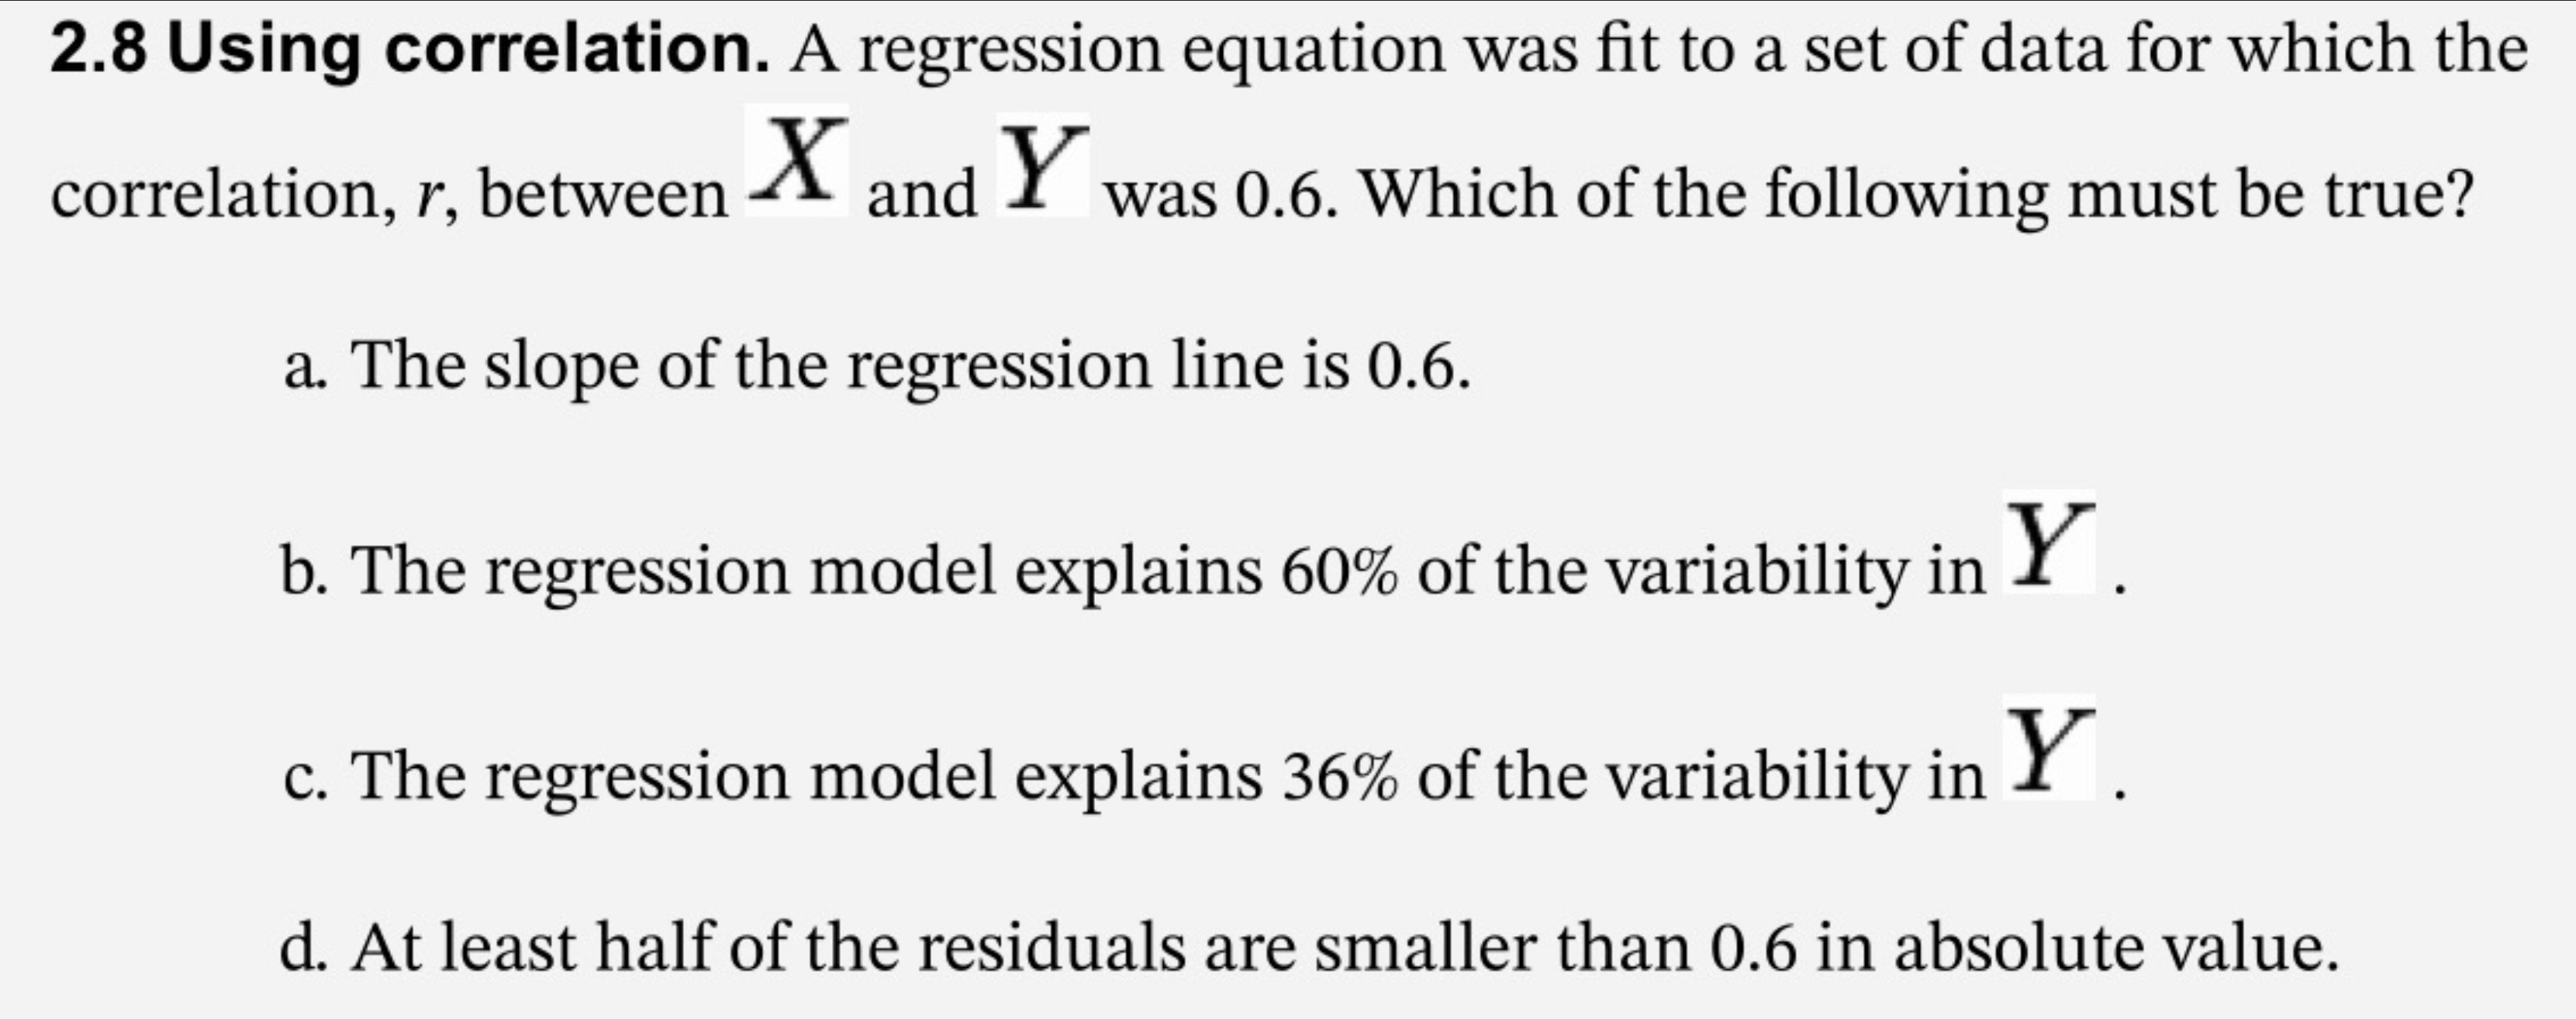
1.2 Residual plots to check conditions. For which of the following conditions for inference in regression does a residual plot not aid in assessing whether the condition is satised? a. Linearity b. Constant variance c. Independence (1. Zero mean Q2: Consider the following output which predicts mean sea surface temperature from mean coral growth. Estimate Std. Error tvalue Pr(>|t|) (Intercept) 30.050 1.293 23.234 2.03e-05 *** Growth -4.167 1.502 -2.774 0.0502 . a. What is the slope of the least squares regression line? b. Interpret the estimate of the slope in the context of this setting. c. What is the size of the typical error when predicting mean sea surface temperature when mean growth is 0.89? (The observed mean surface temperature is 26.3 when mean growth is 0.89.) Q3: Consider the fitted regression equation, 37 = 58 0.7K If x1: 20 and y1= 35, what is the residual for the first data point. 2.8 Using correlation. A regression equation was t to a set of data for which the correlation, r, between X and Ywas 0.6. Which of the following must be true? a The slope of the regression line is 0.6. b. The regression model explains 60% of the variability in Y. c. The regression model explains 36% of the variability in Y. d. At least half of the residuals are smaller than 0.6 in absolute value
Step by Step Solution
There are 3 Steps involved in it

Get step-by-step solutions from verified subject matter experts