

Question: Please answer Question 5b) 8 Question 5 A profit/volume (PNV) chart of two companies (A and B) for a period follows: 100 Company A 15-
Please answer Question 5b)
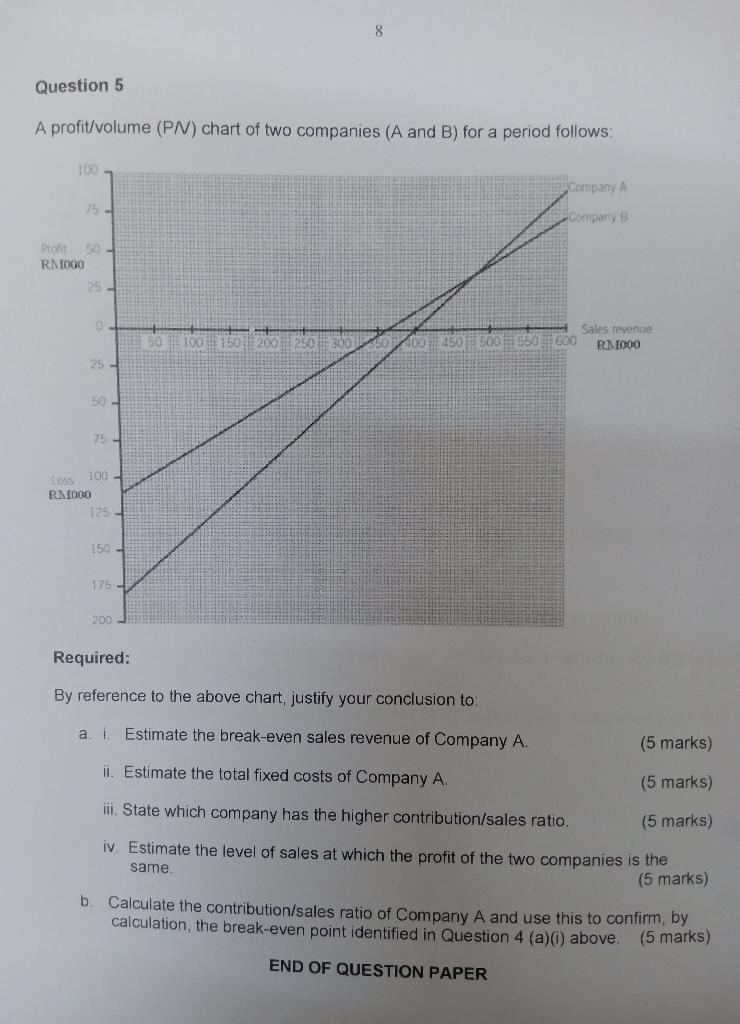
8 Question 5 A profit/volume (PNV) chart of two companies (A and B) for a period follows: 100 Company A 15- Company Profit 50 RM1000 25 to toonto 20 bolo 00 Sales revenuse 450 500 550 600 R1_1000 25 l 75 05 100 - RM1000 12 150 - 175 - 200 Required: By reference to the above chart, justify your conclusion to: a. i. Estimate the break-even sales revenue of Company A. (5 marks) ii. Estimate the total fixed costs of Company A. (5 marks) iii. State which company has the higher contribution/sales ratio. (5 marks) iv. Estimate the level of sales at which the profit of the two companies is the same (5 marks) Calculate the contribution/sales ratio of Company A and use this to confirm, by calculation, the break-even point identified in Question 4 (a)) above. (5 marks) b END OF QUESTION PAPER
Step by Step Solution
There are 3 Steps involved in it

Get step-by-step solutions from verified subject matter experts