

Question: Hi Tutor, need your help, please. Thank you. Question 5 A profit/volume (PN) chart of two companies (A and B) for a period follows: 100
Hi Tutor, need your help, please. Thank you.
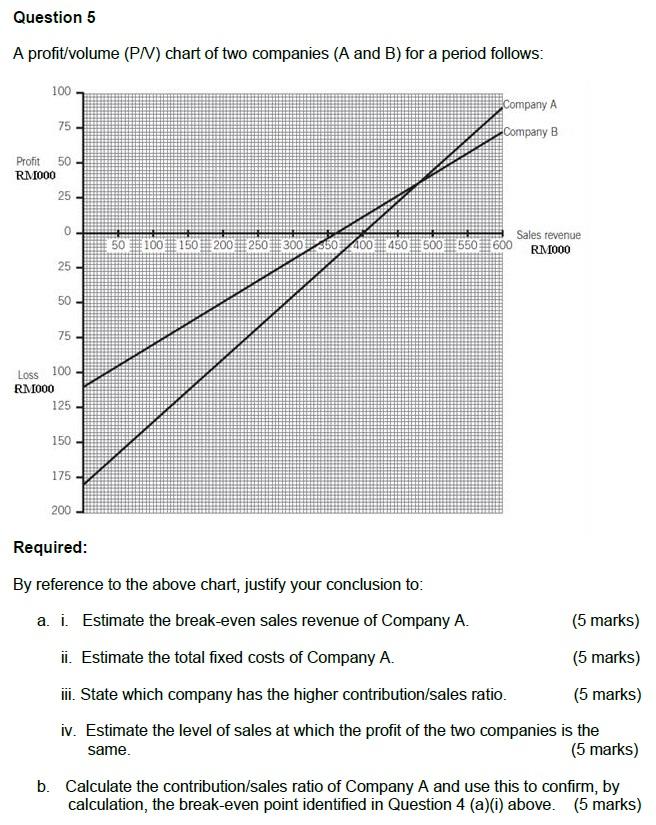
Question 5 A profit/volume (PN) chart of two companies (A and B) for a period follows: 100 Company A Company B 75 50 Profit RM1000 25 0 50 100 150 200 250 30000 150 500 550 Sales revenue 600 RM1000 25 50 75 - LOSS 100 RM1000 125 150 175 200 Required: By reference to the above chart, justify your conclusion to: a. i. Estimate the break-even sales revenue of Company A. (5 marks) ii. Estimate the total fixed costs of Company A. (5 marks) ii. State which company has the higher contribution/sales ratio. (5 marks) iv. Estimate the level of sales at which the profit of the two companies is the same. (5 marks) b. Calculate the contribution/sales ratio of Company A and use this to confirm, by calculation, the break-even point identified in Question 4 (a) () above
Step by Step Solution
There are 3 Steps involved in it

Get step-by-step solutions from verified subject matter experts