

Question: Please answer question 9 and 10 thank you it has more upfront costs. Using this information create a graph of the crossover point for the
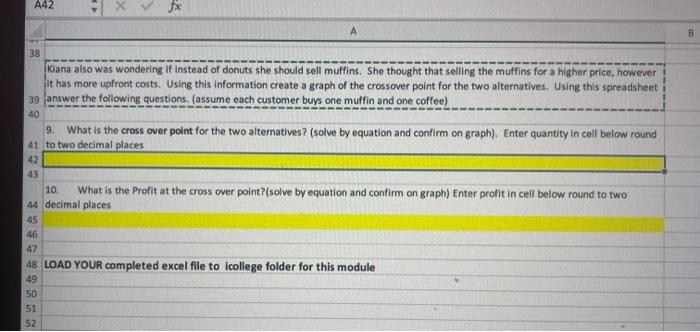
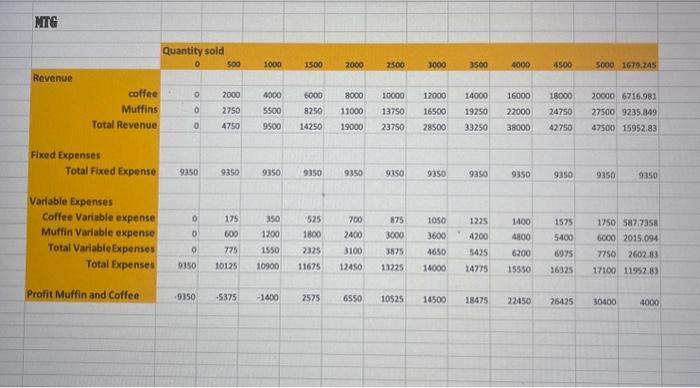
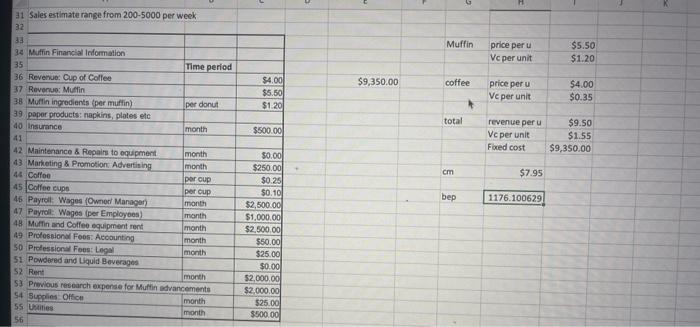
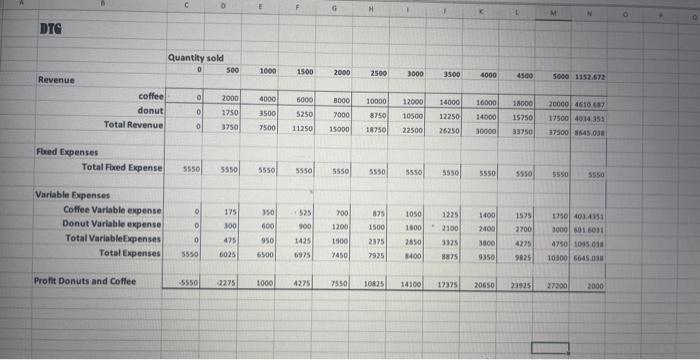
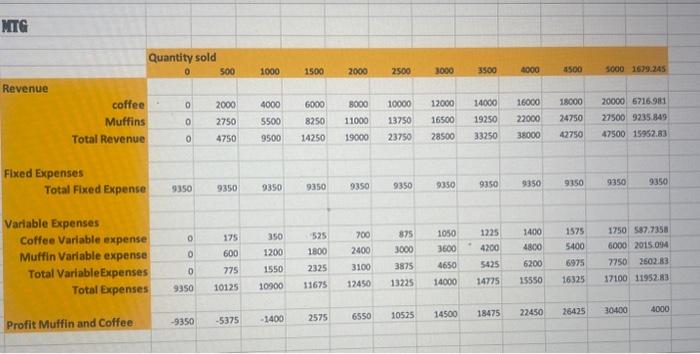
it has more upfront costs. Using this information create a graph of the crossover point for the two alternatives. Using this spreadsheet 39 answer the following questions. (assume each customer buys one muffin and one coffee) 9. What is the cross over polnt for the two aiternatives? (solve by equation and confirm on graph). Enter quantity in cell below round 41 to two decimal places 42 43 10. What is the Profit at the cross over point?(solve by equation and confirm on graph) Enter profit in cell below round to two 44 decimal places 45 46 47 48 LOAD YOUR completed excel file to icollege folder for this module 49 50 51 52 Fixed fxpenses Variable Expenses 31 Sales estimate range from 200-5000 per week DTE Quantity sold Revenue Fued Expenses Quantity sold Revenue Fixed Expenses \begin{tabular}{|l|l|l|l|l|l|l|l|l|l|l|l|l|} \hline Total Fixed Expense & 9350 & 9350 & 9350 & 9350 & 9350 & 9350 & 9350 & 9350 & 9350 & 9350 & 9350 & 9350 \\ \hline \end{tabular} Variable Expenses \begin{tabular}{|l|l|l|l|l|l|l|l|l|l|l|l|l|} \hline Profit Muffin and Coffee & -9350 & -5375 & -1400 & 2575 & 6550 & 10525 & 14500 & 13475 & 22450 & 26425 & 30400 & 4000 \\ \hline \end{tabular}
Step by Step Solution
There are 3 Steps involved in it

Get step-by-step solutions from verified subject matter experts