

Question: please answer question CASE R. U. REDDIE FOR LOCATION The R. U. Reddie Corporation, located in Chicago, manu- factures clothing specially designed for stuffed cartoon
please answer question
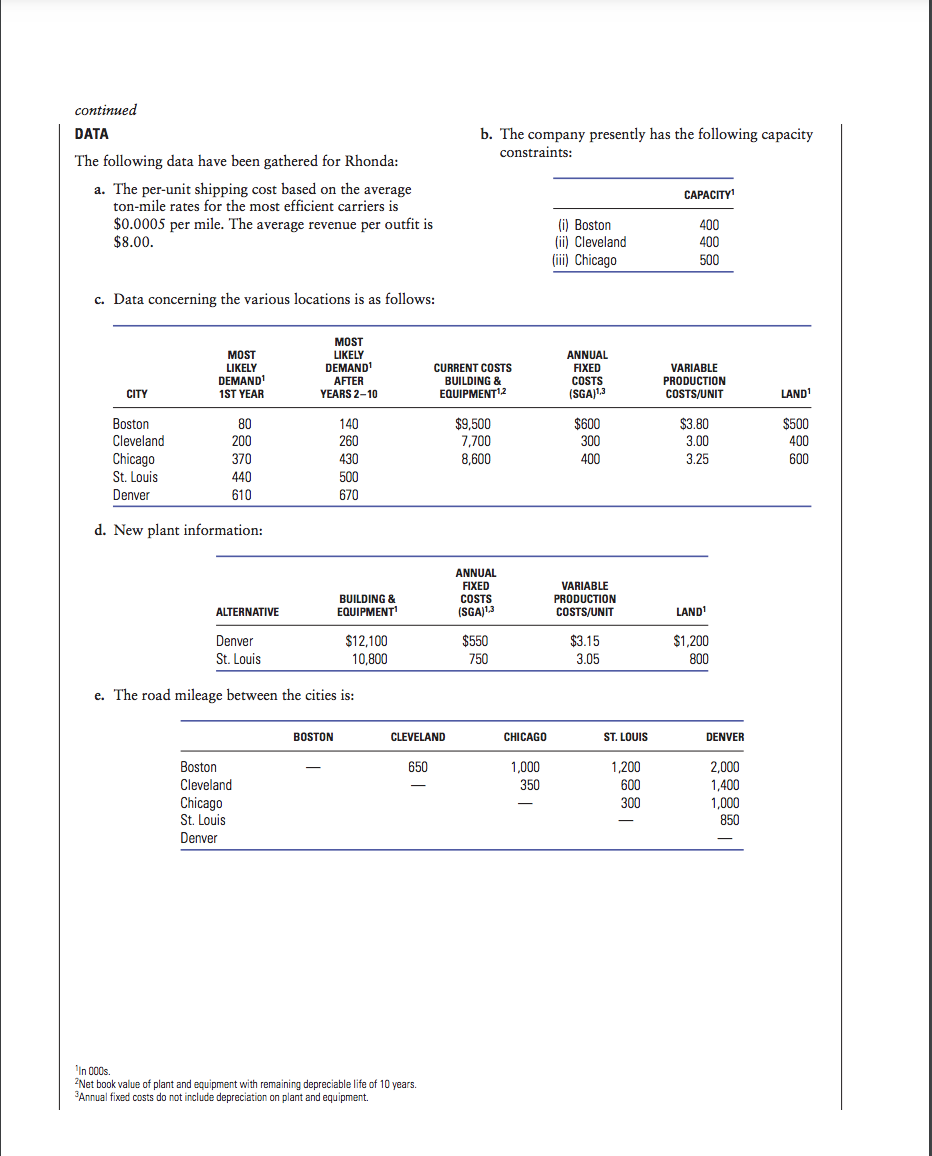
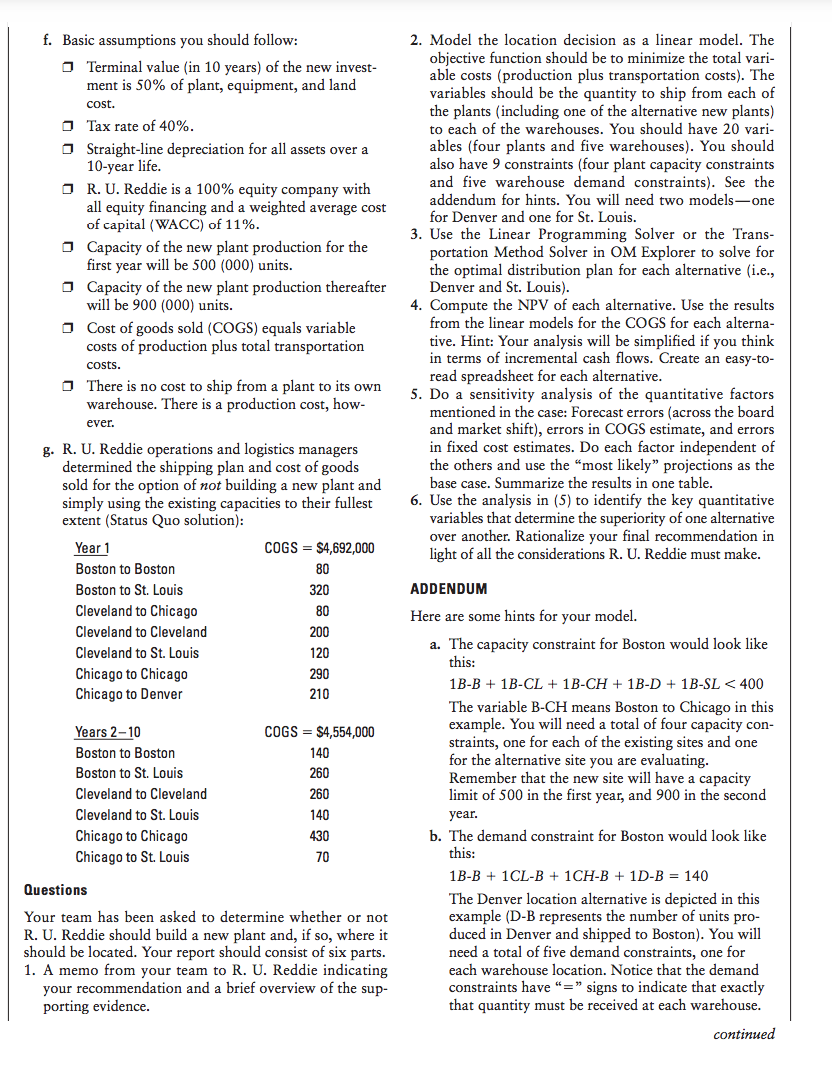
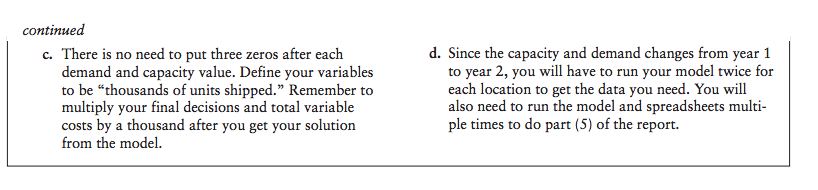
CASE R. U. REDDIE FOR LOCATION The R. U. Reddie Corporation, located in Chicago, manu- factures clothing specially designed for stuffed cartoon animals such as Snoopy and Wile-E-Coyote. Among the popular products are a wedding tuxedo for Snoopy and a flak jacket for Wile-E-Coyote. The latter is capable of stopping an Acme Rocket at close range. .. sometimes. For many sales, the company relies upon the help of spoiled children who refuse to leave the toy store until their parents purchase a wardrobe for their stuffed toys. Rhonda Ulysses Reddie, owner of the company, is con- cerned over the market projections that indicate demand for the product is substantially greater than current plant capacity. The "most likely" projections indicate that the company will be short by 400,000 units next year, and thereafter 700,000 units annually. As such, Rhonda is con- sidering opening a new plant to produce additional units. BACKGROUND The R. U. Reddie Corporation currently has three plants, which are located in Boston, Cleveland, and Chicago, respectively. The company's first plant was the Chicago plant, but as sales grew in the Midwest and Northeast, the Cleveland and Boston plants were built in short order. As the demand for wardrobes for stuffed animals moved west, warehouse centers were opened in St. Louis and Denver. The capacities of the three plants were incremen- tally increased to accommodate the demand. Each plant has its own warehouse to satisfy demands in its own area. Extra capacity left over was used to ship product to St. Louis or Denver. The new long-term forecasts provided by the Sales Department were both good news and bad news. The added revenues would certainly help Rhonda's profitabil- ity, but the company would have to buy another plant to realize the added profits. Space is not available at the exist- ing plants, and the benefits of the new technology for man- ufacturing stuffed animal wardrobes are tantalizing. These factors motivated the search for the best location for a new plant. Rhonda has identified Denver and St. Louis as pos- sible locations for the new plant. demands could be as low as 1,800,000 or as high as 2,200,000, with each city being affected the same as the others. Second, the marketing manager expressed a con- cern over a possible market shift from the Midwest and Northeast to the West. Under this scenario, there would be an additional demand of 50,000 units in St. Louis and 150,000 units in Denver, with the other cities staying at the "most likely" demand projections. Financial. Rhonda realized that the net present value (NPV) of each alternative is an important input to the final decision. However, the accuracy of the estimates for the various costs is critical to determining good estimates of cash flows. She wondered if her decision would change if the COGS (variable production plus transportation costs) for each option was off by +10%. That is, what if the variable production costs and transportation costs of St. Louis are 10% higher than estimated while the variable production costs and transportation costs for Denver are 10% lower than estimated? Or vice versa? Further, what if the estimate for fixed costs is off by 10%? For example, suppose St. Louis is 10% higher while Denver is 10% lower, or vice versa. Would the recommendation change under any of these situations? Operations. The ultimate location of the new plant will determine the distribution assignments and the level of uti- lization of each plant in the network. Cutting back pro- duction in any of the plants will change the distribution assignments of all plants. Since there will be excess capac- ity in the system with a new plant under the assumption of the "most likely" demand projections, the capacity of the Cleveland plant could be cut in year 2 and beyond. Suppose Cleveland cuts back production by 50 (000) units a year from year 2 and beyond. Will this affect the choice between Denver and St. Louis? What is the impact on the distribution assignments of the plant? Further, there are some nonquantifiable concerns. First, the availability of a good workforce is much better in Denver than St. Louis because of the recent shutdown of a beanie baby factory. The labor market is much tighter in St. Louis and the prog- nosis is for continued short supply in the foreseeable future. Second, Denver metropolitan area has just insti- tuted strict environmental regulations. Rhonda's new plant would adhere to existing laws, but the area is very environmentally conscious and more regulations may be coming in the future. It is very costly to modify a plant once operations have begun. Finally, Denver has a number of good suppliers with the capability to assist in produc- tion design (new wardrobe fashions). St. Louis also has suppliers but they cannot help with product development. Proximity to suppliers with product development capabil- ity is a "plus" for this industry. continued RHONDA'S CONCERNS A plant addition is a big decision. Rhonda started to think about the accuracy of the data she was able to obtain. She had market, financial, and operations concerns. Market. The projected demands for years 2 through 10 show an annual increase of 700,000 units to a total of 2,000,000 units for each year. She had two concerns here. First, what if the projections for each city were off plus or minus 10% equally across the board? That is, total annual continued DATA b. The company presently has the following capacity constraints: CAPACITY The following data have been gathered for Rhonda: a. The per-unit shipping cost based on the average ton-mile rates for the most efficient carriers is $0.0005 per mile. The average revenue per outfit is $8.00. (i) Boston (ii) Cleveland (iii) Chicago 400 400 500 c. Data concerning the various locations is as follows: MOST LIKELY DEMAND 1ST YEAR MOST LIKELY DEMAND AFTER YEARS 2-10 CURRENT COSTS BUILDING & EQUIPMENT12 ANNUAL FIXED COSTS VARIABLE PRODUCTION COSTS/UNIT CITY (SGA) LAND $3.80 Boston Cleveland Chicago St. Louis Denver 80 200 370 440 610 3.00 140 260 430 500 670 $9,500 7,700 8,600 $600 300 400 $500 400 600 3.25 d. New plant information: ANNUAL FIXED COSTS (SGA)1.2 BUILDING & EQUIPMENT VARIABLE PRODUCTION COSTS/UNIT ALTERNATIVE LAND Denver St. Louis $12,100 10.800 $550 750 $3.15 3.05 $1,200 800 e. The road mileage between the cities is: BOSTON CLEVELAND CHICAGO ST. LOUIS . DENVER 650 1,000 350 1,200 600 Boston Cleveland Chicago St. Louis Denver 300 2,000 1,400 1,000 850 ' In 000s. 2Net book value of plant and equipment with remaining depreciable life of 10 years. Annual fixed costs do not include depreciation on plant and equipment. f. Basic assumptions you should follow: Terminal value (in 10 years) of the new invest- ment is 50% of plant, equipment, and land cost. 2. Model the location decision as a linear model. The objective function should be to minimize the total vari- able costs (production plus transportation costs). The variables should be the quantity to ship from each of the plants (including one of the alternative new plants) to each of the warehouses. You should have 20 vari- ables (four plants and five warehouses). You should also have 9 constraints (four plant capacity constraints and five warehouse demand constraints). See the addendum for hints. You will need two models-one for Denver and one for St. Louis. 3. Use the Linear Programming Solver or the Trans- portation Method Solver in OM Explorer to solve for the optimal distribution plan for each alternative (i.e., Denver and St. Louis). 4. Compute the NPV of each alternative. Use the results from the linear models for the COGS for each alterna- tive. Hint: Your analysis will be simplified if you think in terms of incremental cash flows. Create an easy-to- read spreadsheet for each alternative. 5. Do a sensitivity analysis of the quantitative factors mentioned in the case: Forecast errors (across the board and market shift), errors in COGS estimate, and errors in fixed cost estimates. Do each factor independent of the others and use the "most likely" projections as the base case. Summarize the results in one table. 6. Use the analysis in (5) to identify the key quantitative variables that determine the superiority of one alternative over another. Rationalize your final recommendation in light of all the considerations R. U. Reddie must make. Tax rate of 40%. Straight-line depreciation for all assets over a 10-year life. DR. U. Reddie is a 100% equity company with all equity financing and a weighted average cost of capital (WACC) of 11%. Capacity of the new plant production for the first year will be 500 (000) units. Capacity of the new plant production thereafter will be 900 (000) units. Cost of goods sold (COGS) equals variable costs of production plus total transportation costs. There is no cost to ship from a plant to its own warehouse. There is a production cost, how- ever. g. R. U. Reddie operations and logistics managers determined the shipping plan and cost of goods sold for the option of not building a new plant and simply using the existing capacities to their fullest extent (Status Quo solution): Year 1 COGS = $4,692,000 Boston to Boston 80 Boston to St. Louis 320 Cleveland to Chicago 80 Cleveland to Cleveland 200 Cleveland to St. Louis 120 Chicago to Chicago 290 Chicago to Denver 210 a Years 2-10 Boston to Boston Boston to St. Louis Cleveland to Cleveland Cleveland to St. Louis Chicago to Chicago Chicago to St. Louis COGS = $4,554,000 140 260 260 140 430 ADDENDUM Here are some hints for your model. a. The capacity constraint for Boston would look like this: 1B-B + 1B-CL + 1B-CH + 1B-D + 1B-SL
Step by Step Solution
There are 3 Steps involved in it

Get step-by-step solutions from verified subject matter experts