

The R.U. Reddie Corporation, located in Chicago, manufactures clothing specially designed for stuffed cartoon animals such as
Question:
The R.U. Reddie Corporation, located in Chicago, manufactures clothing specially designed for stuffed cartoon animals such as Snoopy and Wile E. Coyote.
Among the popular products are a wedding tuxedo for Snoopy and a flak jacket for Wile E. Coyote.
For many sales, the company relies upon the help of incorrigible children who refuse to leave the toy store until their parents purchase a wardrobe for their stuffed toys. Rhonda Ulysses Reddie, owner of the company, is concerned over the market projections that indicate demand for the product is substantially greater than current plant capacity. The "most likely" projections indicate that the company will be short by 400,000 units next year, and thereafter 700,000 units annually. As such, Rhonda is considering opening a new plant to produce additional units.
Background
The R.U. Reddie Corporation currently has three plants located in Boston, Cleveland, and Chicago. The company's first plant was the Chicago location, but as sales grew in the Midwest and Northeast, the Cleveland and Boston plants were built in short order. As the demand for wardrobes for stuffed animals moved west, warehouse centers were opened in St. Louis and Denver.
The capacities of the three plants were increased to accommodate the demand. Each plant has its own warehouse to satisfy demands in its own area.
Extra capacity was used to ship the product to St. Louis or Denver.
The new long-term forecasts provided by the sales department contain both good news and bad news. The added revenues will certainly help Rhonda's profitability, but the company would have to buy another plant to realize the added profits. Space is not available at the existing plants, and the benefits of the new technology for manufacturing stuffed animal wardrobes are tantalizing. These factors motivate the search for the best location for a new plant. Rhonda identifies Denver and St. Louis as possible locations.
Rhonda's Concerns
A plant addition is a big decision. Rhonda has started to think about the net present value of each alternative, as it will be an important factor in making the final decision. She also wanted to take into account the nonquantifiable factors. First, the availability of a good workforce is much better in Denver than St. Louis because of the recent shutdown of a Beanie Baby factory. The labor market is much tighter in St. Louis and the prognosis is for continued short supply in the foreseeable future. Second, the Denver metropolitan area just instituted strict environmental regulations. Rhonda's new plant would adhere to existing laws, but the area is highly environmentally conscious, and more regulations may be coming in the future. It is costly to modify a plant once operations begin. Finally, Denver has a number of good suppliers with the capability to assist in production design (new wardrobe fashions).
St. Louis also has suppliers, but they cannot help with product development.
Proximity to suppliers with product development capability is a "plus" for this industry.
Data
The following data have been gathered for Rhonda:
1. The per-unit shipping cost based on the average ton-mile rates for the most efficient carriers is $0.0005 per mile. The average revenue per outfit is $8.00.
2. The company currently has the following capacity (in thousands) constraints: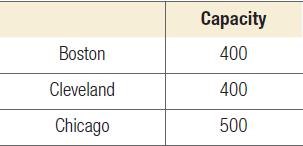
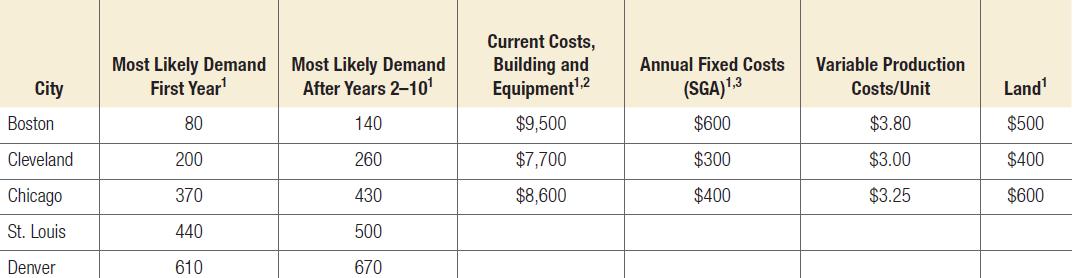
3. Data concerning the various locations are found in Table 13.8.
4. New plant information: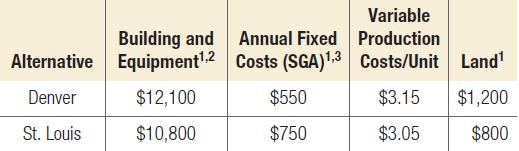
5. The road mileage between the cities is as follows: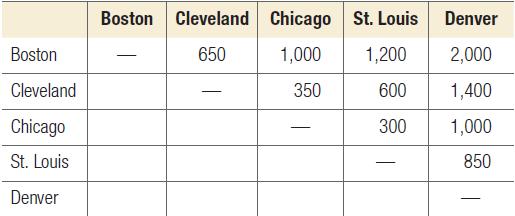
6. Basic assumptions you should follow:
▪▪ Terminal value (in 10 years) of the new investment is 50 percent of plant, equipment, and land cost.
▪▪ The tax rate is 40 percent.
▪▪ Straight-line depreciation is used for all assets over a 10-year life.
▪▪ R.U. Reddie is a 100 percent equity company with all equity financing and a weighted average cost of capital (WACC) of 11 percent.
▪▪ Capacity of the new plant production for the first year will be 500 (000) units.
▪▪ Capacity of the new plant production thereafter will be 900 (000) units.
▪▪ Cost of goods sold (COGS) equals variable costs of production plus total transportation costs.
▪▪ Costs to ship from a plant to its own warehouse are zero; however, variable production costs are applicable.
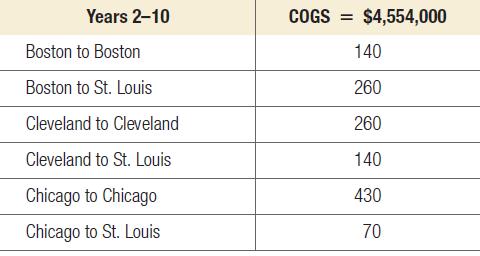
7. R.U. Reddie operations and logistics managers determined the shipping plan and cost of goods sold for the option of not building a new plant and simply using the existing capacities to their fullest extent (status quo solution).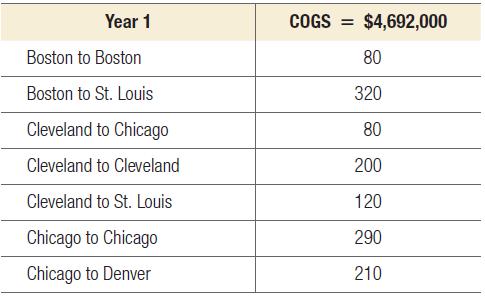
QUESTIONS
Your team has been asked to determine whether R.U. Reddie should build a new plant and, if so, where it should be located.
1. Write a memo from your team to R.U. Reddie indicating your recommendation and a brief overview of the supporting evidence.
2. Use the transportation method for location problems and POM for Windows to find the optimal distribution pattern and the cost of goods sold for both the Denver and St. Louis alternatives. First solve the problem with Denver as the new plant and then do the same for St. Louis. The unit costs for each cell of the transportation matrix should be the sum of the shipping costs and the variable costs of production. For example, the unit costs for producing and shipping a unit from Denver to Boston would be $3.15 + $0.0005(2,000) = $4.15. Use Figures 13.4 and 13.5 as guides in your formulation. The "optimal cost" in each case will be the cost of goods sold.
3. Compute the NPV of each alternative. Use the results from the transportation models for the COGS for each alternative. (Hint: Your analysis will be simplified if you think in terms of incremental cash flows.) Create an easy-to-read spreadsheet for each alternative.
Addendum
Here are some hints for your analysis.
1. Define your variables to be "thousands of units shipped," and omit the three zeroes after each demand and capacity value. Then remember to multiply your final decisions and total variable costs by a thousand after you get your solution from the model.
2. Because the capacity and demand changes from year 1 to year 2, you need to run your model twice for each location to get the necessary data.
Step by Step Answer:
Based on the given scenario and data we need to analyze whether RU Reddie should build a new plant and if so whether the new plant should be located i...View the full answer


Operations Management Processes And Supply Chains
ISBN: 9781292409863
13th Global Edition
Authors: Lee Krajewski, Naresh Malhotra, Larry Ritzman
