

Question: *please answer question correctly and fully* Using the Provided data fill out the table below and summarize the results of the analysis using evidence. Thank
*please answer question correctly and fully* Using the Provided data fill out the table below and summarize the results of the analysis using evidence. Thank you in advance to whoever can help!
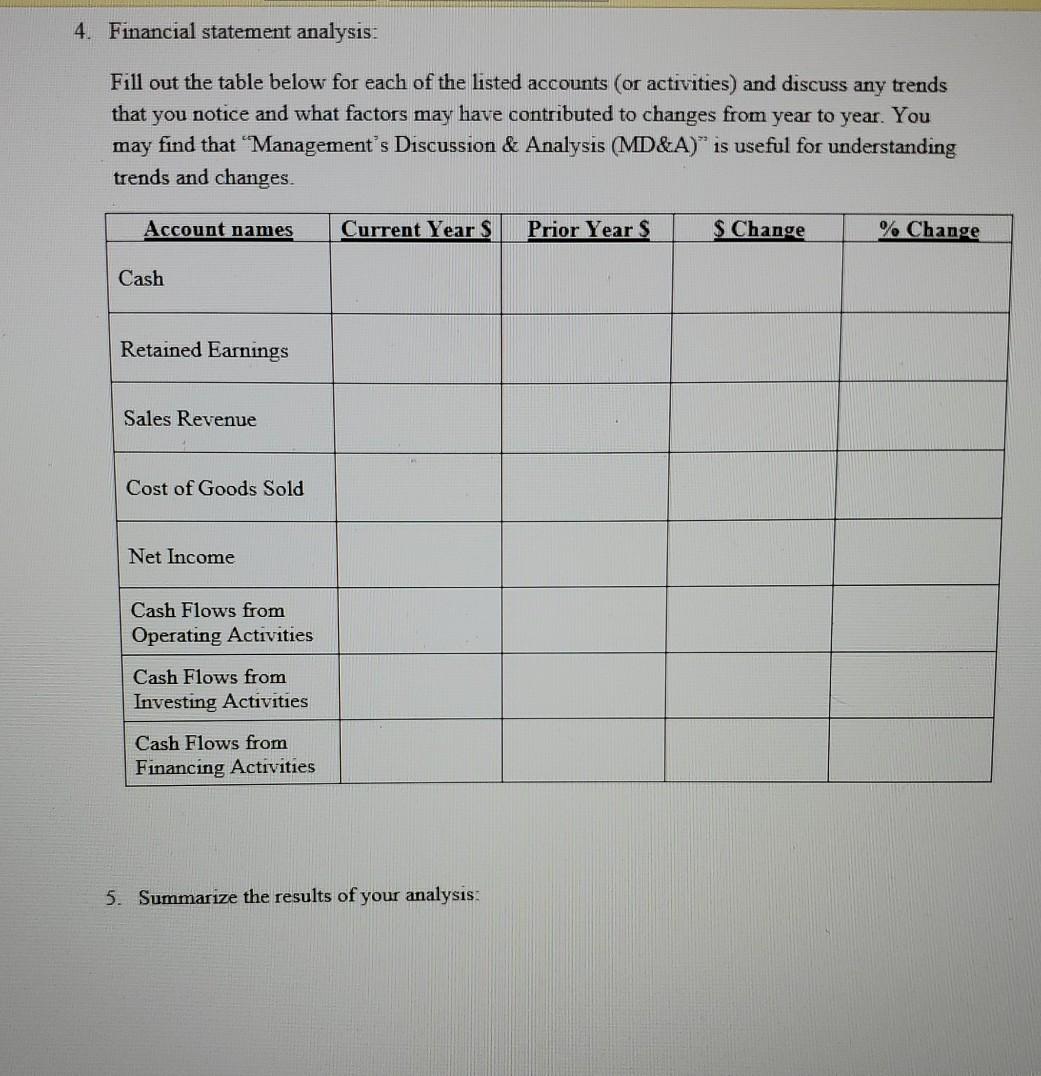
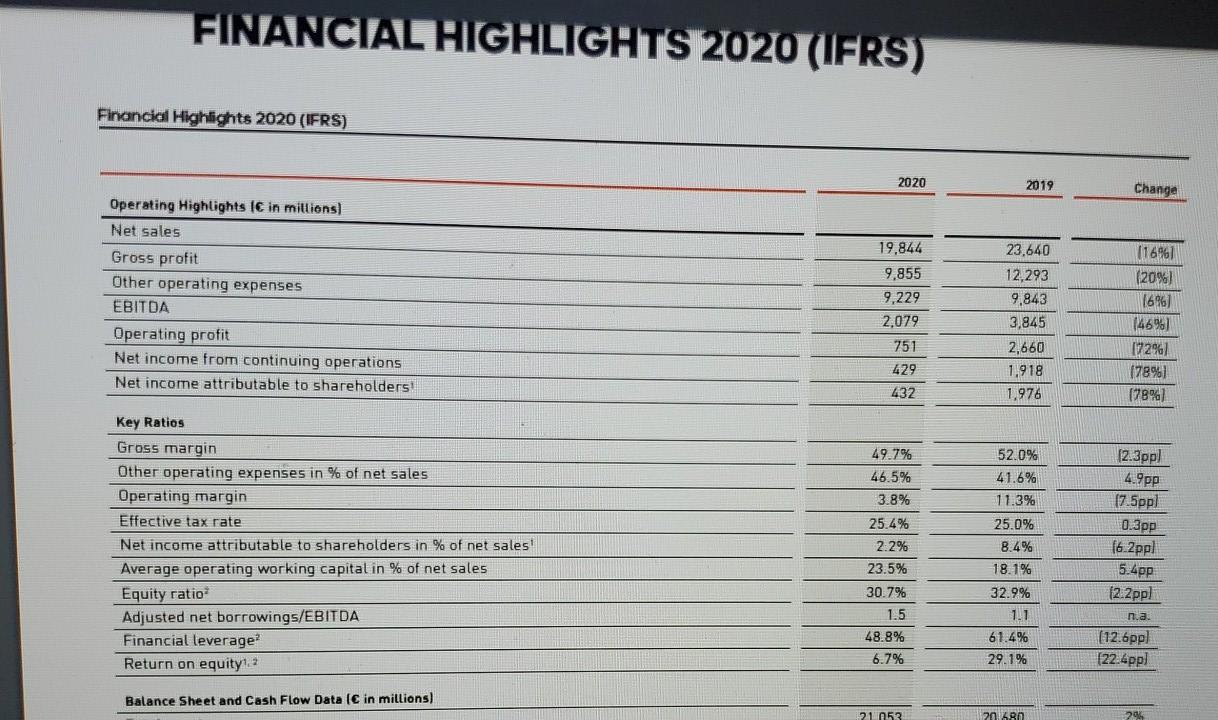
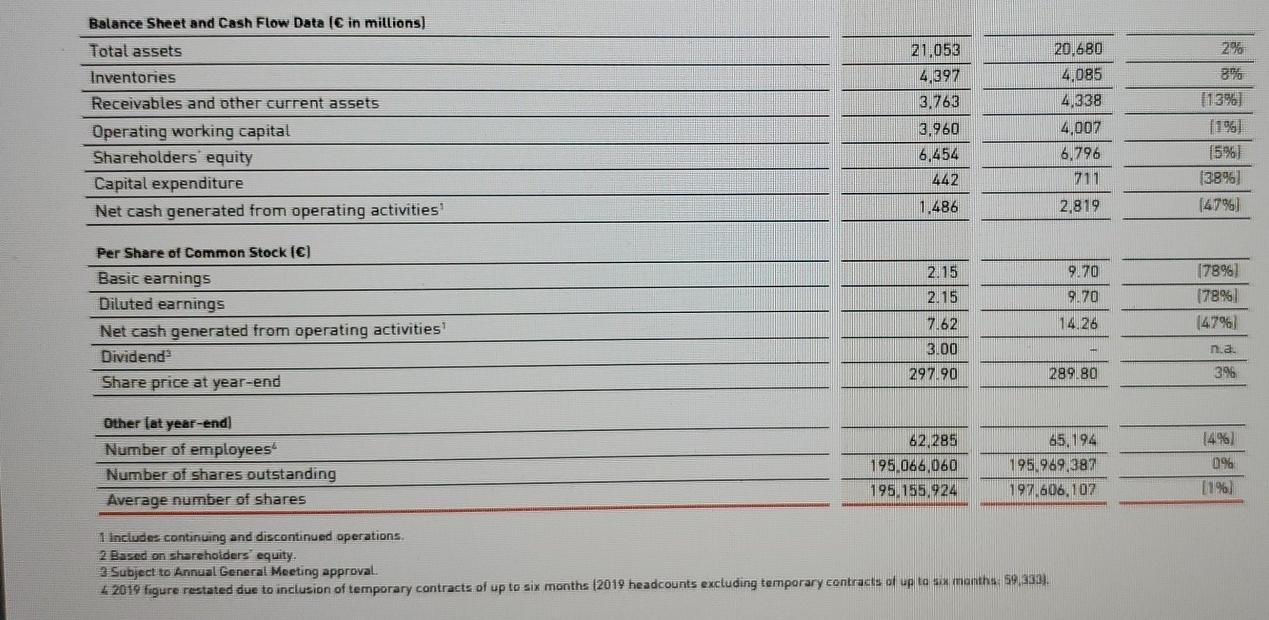
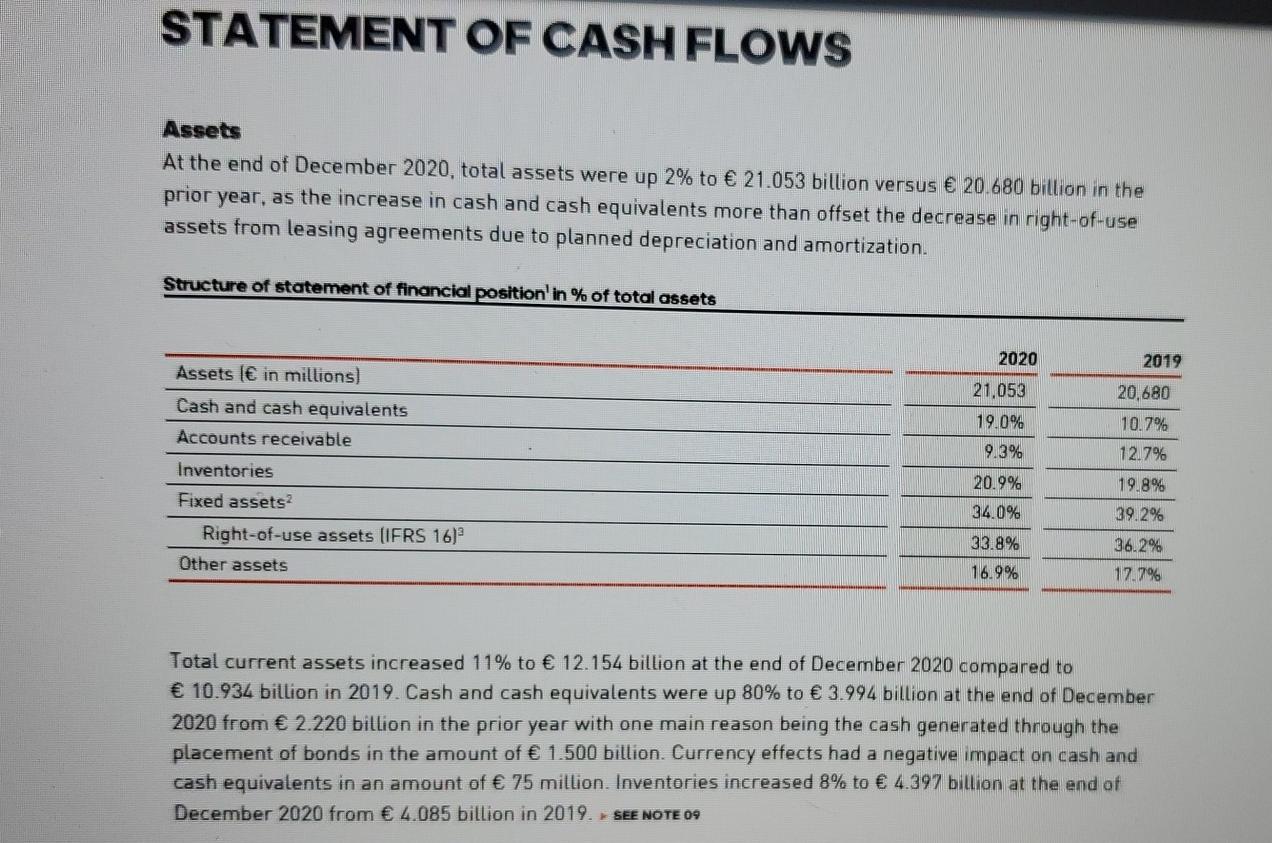
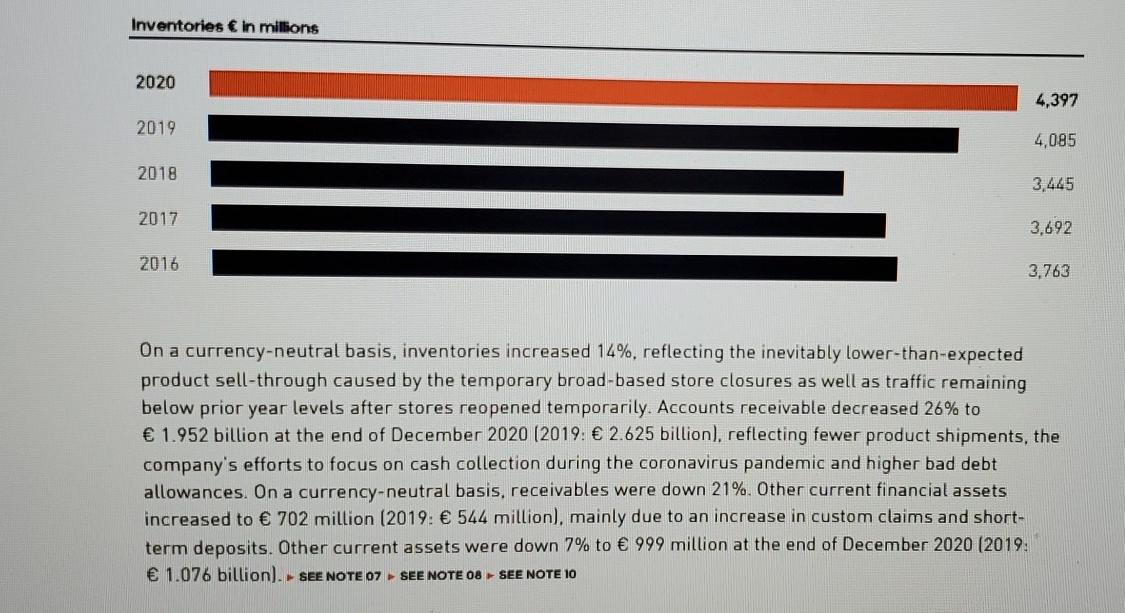
4. Financial statement analysis: Fill out the table below for each of the listed accounts (or activities, and discuss any trends that you notice and what factors may have contributed to changes from year to year. You may find that 'Management's Discussion & Analysis (MD&A)" is useful for understanding trends and changes. Account names Current Year S Prior Year S $ Change % Change Cash Retained Earnings Sales Revenue Cost of Goods Sold Net Income Cash Flows from Operating Activities Cash Flows from Investing Activities Cash Flows from Financing Activities 5. Summarize the results of your analysis: FINANCIAL HIGHLIGHTS 2020 (1FRS) Financial Highlights 2020 (IFRS) 2020 2019 Change Operating Highlights (C in millions) Net sales Gross profit Other operating expenses EBITDA Operating profit Net income from continuing operations Net income attributable to shareholders! 19,844 9,855 9,229 2,079 751 429 432 23,640 12,293 9,843 3,845 2,660 1.918 1,976 (16961 (20%) [66] (46967 17296] 178%) (78%) 52.0% 41.6% 11.3% 25.0% 8.4% (2.3pp) 4.9 pp 17.5ppl Key Ratios Gross margin Other operating expenses in % of net sales Operating margin Effective tax rate Net income attributable to shareholders in % of net sales! Average operating working capital in % of net sales Equity ratio Adjusted net borrowings/EBITDA Financial leverage? Return on equity 2 0.3pp 49.7% 46.5% 3.8% 25.4% 2.2% 23.5% 30.7% 1.5 48.8% 6.7% 18.1% 32.9% 16.2pp! 5.4pp (2.2 pp! n.a. [12.6ppl (22.4pp) 1.1 61.4% 29.1% Balance Sheet and Cash Flow Data ( in millions) 21053 20 280 206 Balance Sheet and Cash Flow Data ( in millions) Total assets Inventories Receivables and other current assets Operating working capital Shareholders equity Capital expenditure Net cash generated from operating activities 21,053 4,397 3.763 3.960 6,454 442 1.486 20.680 4,085 4,338 4,007 6,796 711 2% 896 (13%) [19] (5%) (38%) [4796) 2,819 Per Share of Common Stock () 2.15 2.15 7.62 9.70 9.70 78%) 78% 147%) 14.26 Basic earnings Diluted earnings Net cash generated from operating activities Dividend Share price at year-end 3.00 nia 297.90 289.80 3%6 Other (at year-end) Number of employees Number of shares outstanding Average number of shares 62,285 195.066,060 195.155,924 65,194 195,969,387 197,606, 107 (4%) 0% 11%) 1 includes continuing and discontinued operations 2 Based on shareholders equity. 3 Subject to Annual General Meeting approval. 4 2019 figure restated due to inclusion of temporary contracts of up to six months (2019 headcounts excluding temporary contracts of up to six months: 59.233) STATEMENT OF CASH FLOWS Assets At the end of December 2020, total assets were up 2% to 21.053 billion versus 20.680 billion in the prior year, as the increase in cash and cash equivalents more than offset the decrease in right-of-use assets from leasing agreements due to planned depreciation and amortization. Structure of statement of financial position' in % of total assets 2020 2019 21.053 19.0% 9.3% Assets ( in millions) Cash and cash equivalents Accounts receivable Inventories Fixed assets Right-of-use assets (IFRS 16) Other assets 20.9% 34.0% 20,680 10.7% 12.7% 19.8% 39.2% 36.2% 17.7% 33.8% 16.9% Total current assets increased 11% to 12.154 billion at the end of December 2020 compared to 10.934 billion in 2019. Cash and cash equivalents were up 80% to 3.994 billion at the end of December 2020 from 2.220 billion in the prior year with one main reason being the cash generated through the placement of bonds in the amount of 1.500 billion. Currency effects had a negative impact on cash and cash equivalents in an amount of 75 million. Inventories increased 8% to 4.397 billion at the end of December 2020 from 4.085 billion in 2019. SEE NOTE 09 Inventories in millions 2020 4,397 2019 4,085 2018 3,445 2017 3,692 2016 3,763 On a currency-neutral basis, inventories increased 14%, reflecting the inevitably lower-than-expected product sell-through caused by the temporary broad-based store closures as well as traffic remaining below prior year levels after stores reopened temporarily. Accounts receivable decreased 26% to 1.952 billion at the end of December 2020 (2019: 2.625 billion), reflecting fewer product shipments, the company's efforts to focus on cash collect during the core pandemic and higher bad debt allowances. On a currency-neutral basis, receivables were down 21%. Other current financial assets increased to 702 million (2019: 544 million), mainly due to an increase in custom claims and short- term deposits. Other current assets were down 7% to 999 million at the end of December 2020 (2019. 1.076 billion). SEE NOTE 07 SEE NOTE 08 SEE NOTE 10 4. Financial statement analysis: Fill out the table below for each of the listed accounts (or activities, and discuss any trends that you notice and what factors may have contributed to changes from year to year. You may find that 'Management's Discussion & Analysis (MD&A)" is useful for understanding trends and changes. Account names Current Year S Prior Year S $ Change % Change Cash Retained Earnings Sales Revenue Cost of Goods Sold Net Income Cash Flows from Operating Activities Cash Flows from Investing Activities Cash Flows from Financing Activities 5. Summarize the results of your analysis: FINANCIAL HIGHLIGHTS 2020 (1FRS) Financial Highlights 2020 (IFRS) 2020 2019 Change Operating Highlights (C in millions) Net sales Gross profit Other operating expenses EBITDA Operating profit Net income from continuing operations Net income attributable to shareholders! 19,844 9,855 9,229 2,079 751 429 432 23,640 12,293 9,843 3,845 2,660 1.918 1,976 (16961 (20%) [66] (46967 17296] 178%) (78%) 52.0% 41.6% 11.3% 25.0% 8.4% (2.3pp) 4.9 pp 17.5ppl Key Ratios Gross margin Other operating expenses in % of net sales Operating margin Effective tax rate Net income attributable to shareholders in % of net sales! Average operating working capital in % of net sales Equity ratio Adjusted net borrowings/EBITDA Financial leverage? Return on equity 2 0.3pp 49.7% 46.5% 3.8% 25.4% 2.2% 23.5% 30.7% 1.5 48.8% 6.7% 18.1% 32.9% 16.2pp! 5.4pp (2.2 pp! n.a. [12.6ppl (22.4pp) 1.1 61.4% 29.1% Balance Sheet and Cash Flow Data ( in millions) 21053 20 280 206 Balance Sheet and Cash Flow Data ( in millions) Total assets Inventories Receivables and other current assets Operating working capital Shareholders equity Capital expenditure Net cash generated from operating activities 21,053 4,397 3.763 3.960 6,454 442 1.486 20.680 4,085 4,338 4,007 6,796 711 2% 896 (13%) [19] (5%) (38%) [4796) 2,819 Per Share of Common Stock () 2.15 2.15 7.62 9.70 9.70 78%) 78% 147%) 14.26 Basic earnings Diluted earnings Net cash generated from operating activities Dividend Share price at year-end 3.00 nia 297.90 289.80 3%6 Other (at year-end) Number of employees Number of shares outstanding Average number of shares 62,285 195.066,060 195.155,924 65,194 195,969,387 197,606, 107 (4%) 0% 11%) 1 includes continuing and discontinued operations 2 Based on shareholders equity. 3 Subject to Annual General Meeting approval. 4 2019 figure restated due to inclusion of temporary contracts of up to six months (2019 headcounts excluding temporary contracts of up to six months: 59.233) STATEMENT OF CASH FLOWS Assets At the end of December 2020, total assets were up 2% to 21.053 billion versus 20.680 billion in the prior year, as the increase in cash and cash equivalents more than offset the decrease in right-of-use assets from leasing agreements due to planned depreciation and amortization. Structure of statement of financial position' in % of total assets 2020 2019 21.053 19.0% 9.3% Assets ( in millions) Cash and cash equivalents Accounts receivable Inventories Fixed assets Right-of-use assets (IFRS 16) Other assets 20.9% 34.0% 20,680 10.7% 12.7% 19.8% 39.2% 36.2% 17.7% 33.8% 16.9% Total current assets increased 11% to 12.154 billion at the end of December 2020 compared to 10.934 billion in 2019. Cash and cash equivalents were up 80% to 3.994 billion at the end of December 2020 from 2.220 billion in the prior year with one main reason being the cash generated through the placement of bonds in the amount of 1.500 billion. Currency effects had a negative impact on cash and cash equivalents in an amount of 75 million. Inventories increased 8% to 4.397 billion at the end of December 2020 from 4.085 billion in 2019. SEE NOTE 09 Inventories in millions 2020 4,397 2019 4,085 2018 3,445 2017 3,692 2016 3,763 On a currency-neutral basis, inventories increased 14%, reflecting the inevitably lower-than-expected product sell-through caused by the temporary broad-based store closures as well as traffic remaining below prior year levels after stores reopened temporarily. Accounts receivable decreased 26% to 1.952 billion at the end of December 2020 (2019: 2.625 billion), reflecting fewer product shipments, the company's efforts to focus on cash collect during the core pandemic and higher bad debt allowances. On a currency-neutral basis, receivables were down 21%. Other current financial assets increased to 702 million (2019: 544 million), mainly due to an increase in custom claims and short- term deposits. Other current assets were down 7% to 999 million at the end of December 2020 (2019. 1.076 billion). SEE NOTE 07 SEE NOTE 08 SEE NOTE 10
Step by Step Solution
There are 3 Steps involved in it

Get step-by-step solutions from verified subject matter experts