

Question: Please answer question parts a. & b. from the image. Please be clear in your answers. Part b. is slightly cut off this is what
Please answer question parts a. & b. from the image. Please be clear in your answers. Part b. is slightly cut off this is what it says:
b. Based on the estimated regression?model, what percentage of the total variation in average monthly sales can be explained by store?size?
______ ?%?(Type an integer or decimal rounded to one decimal place as?needed.)
In the second image is the data needed to answer the questions.
Thanks!
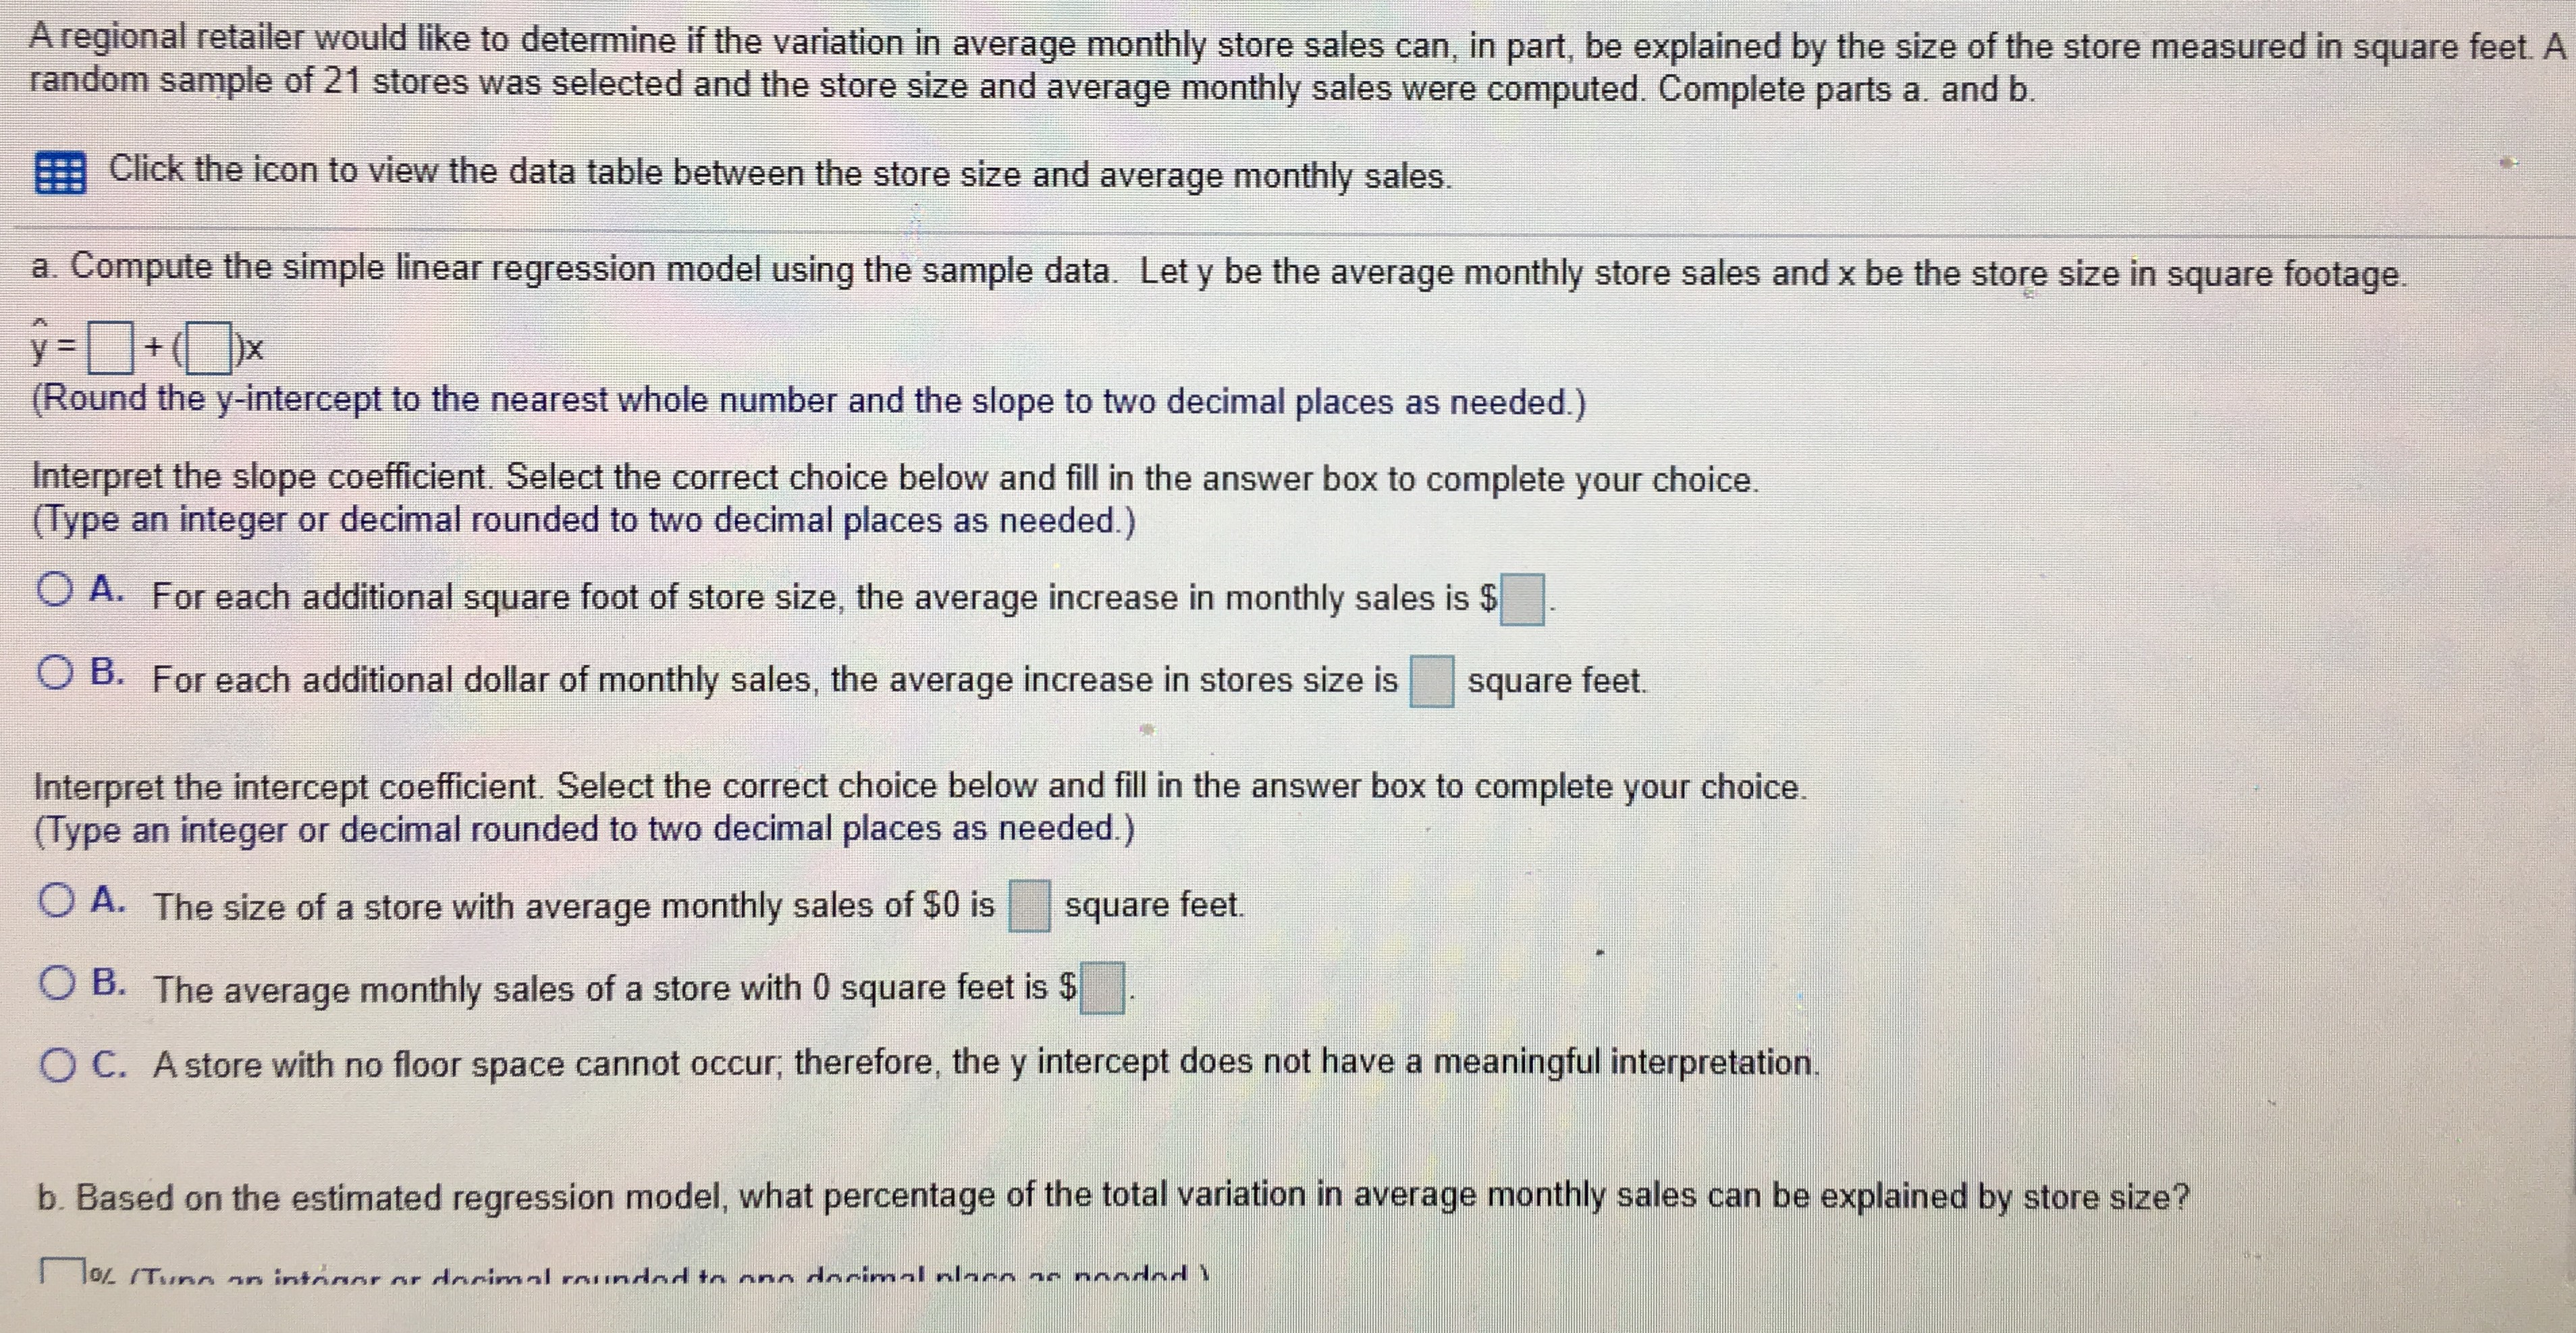
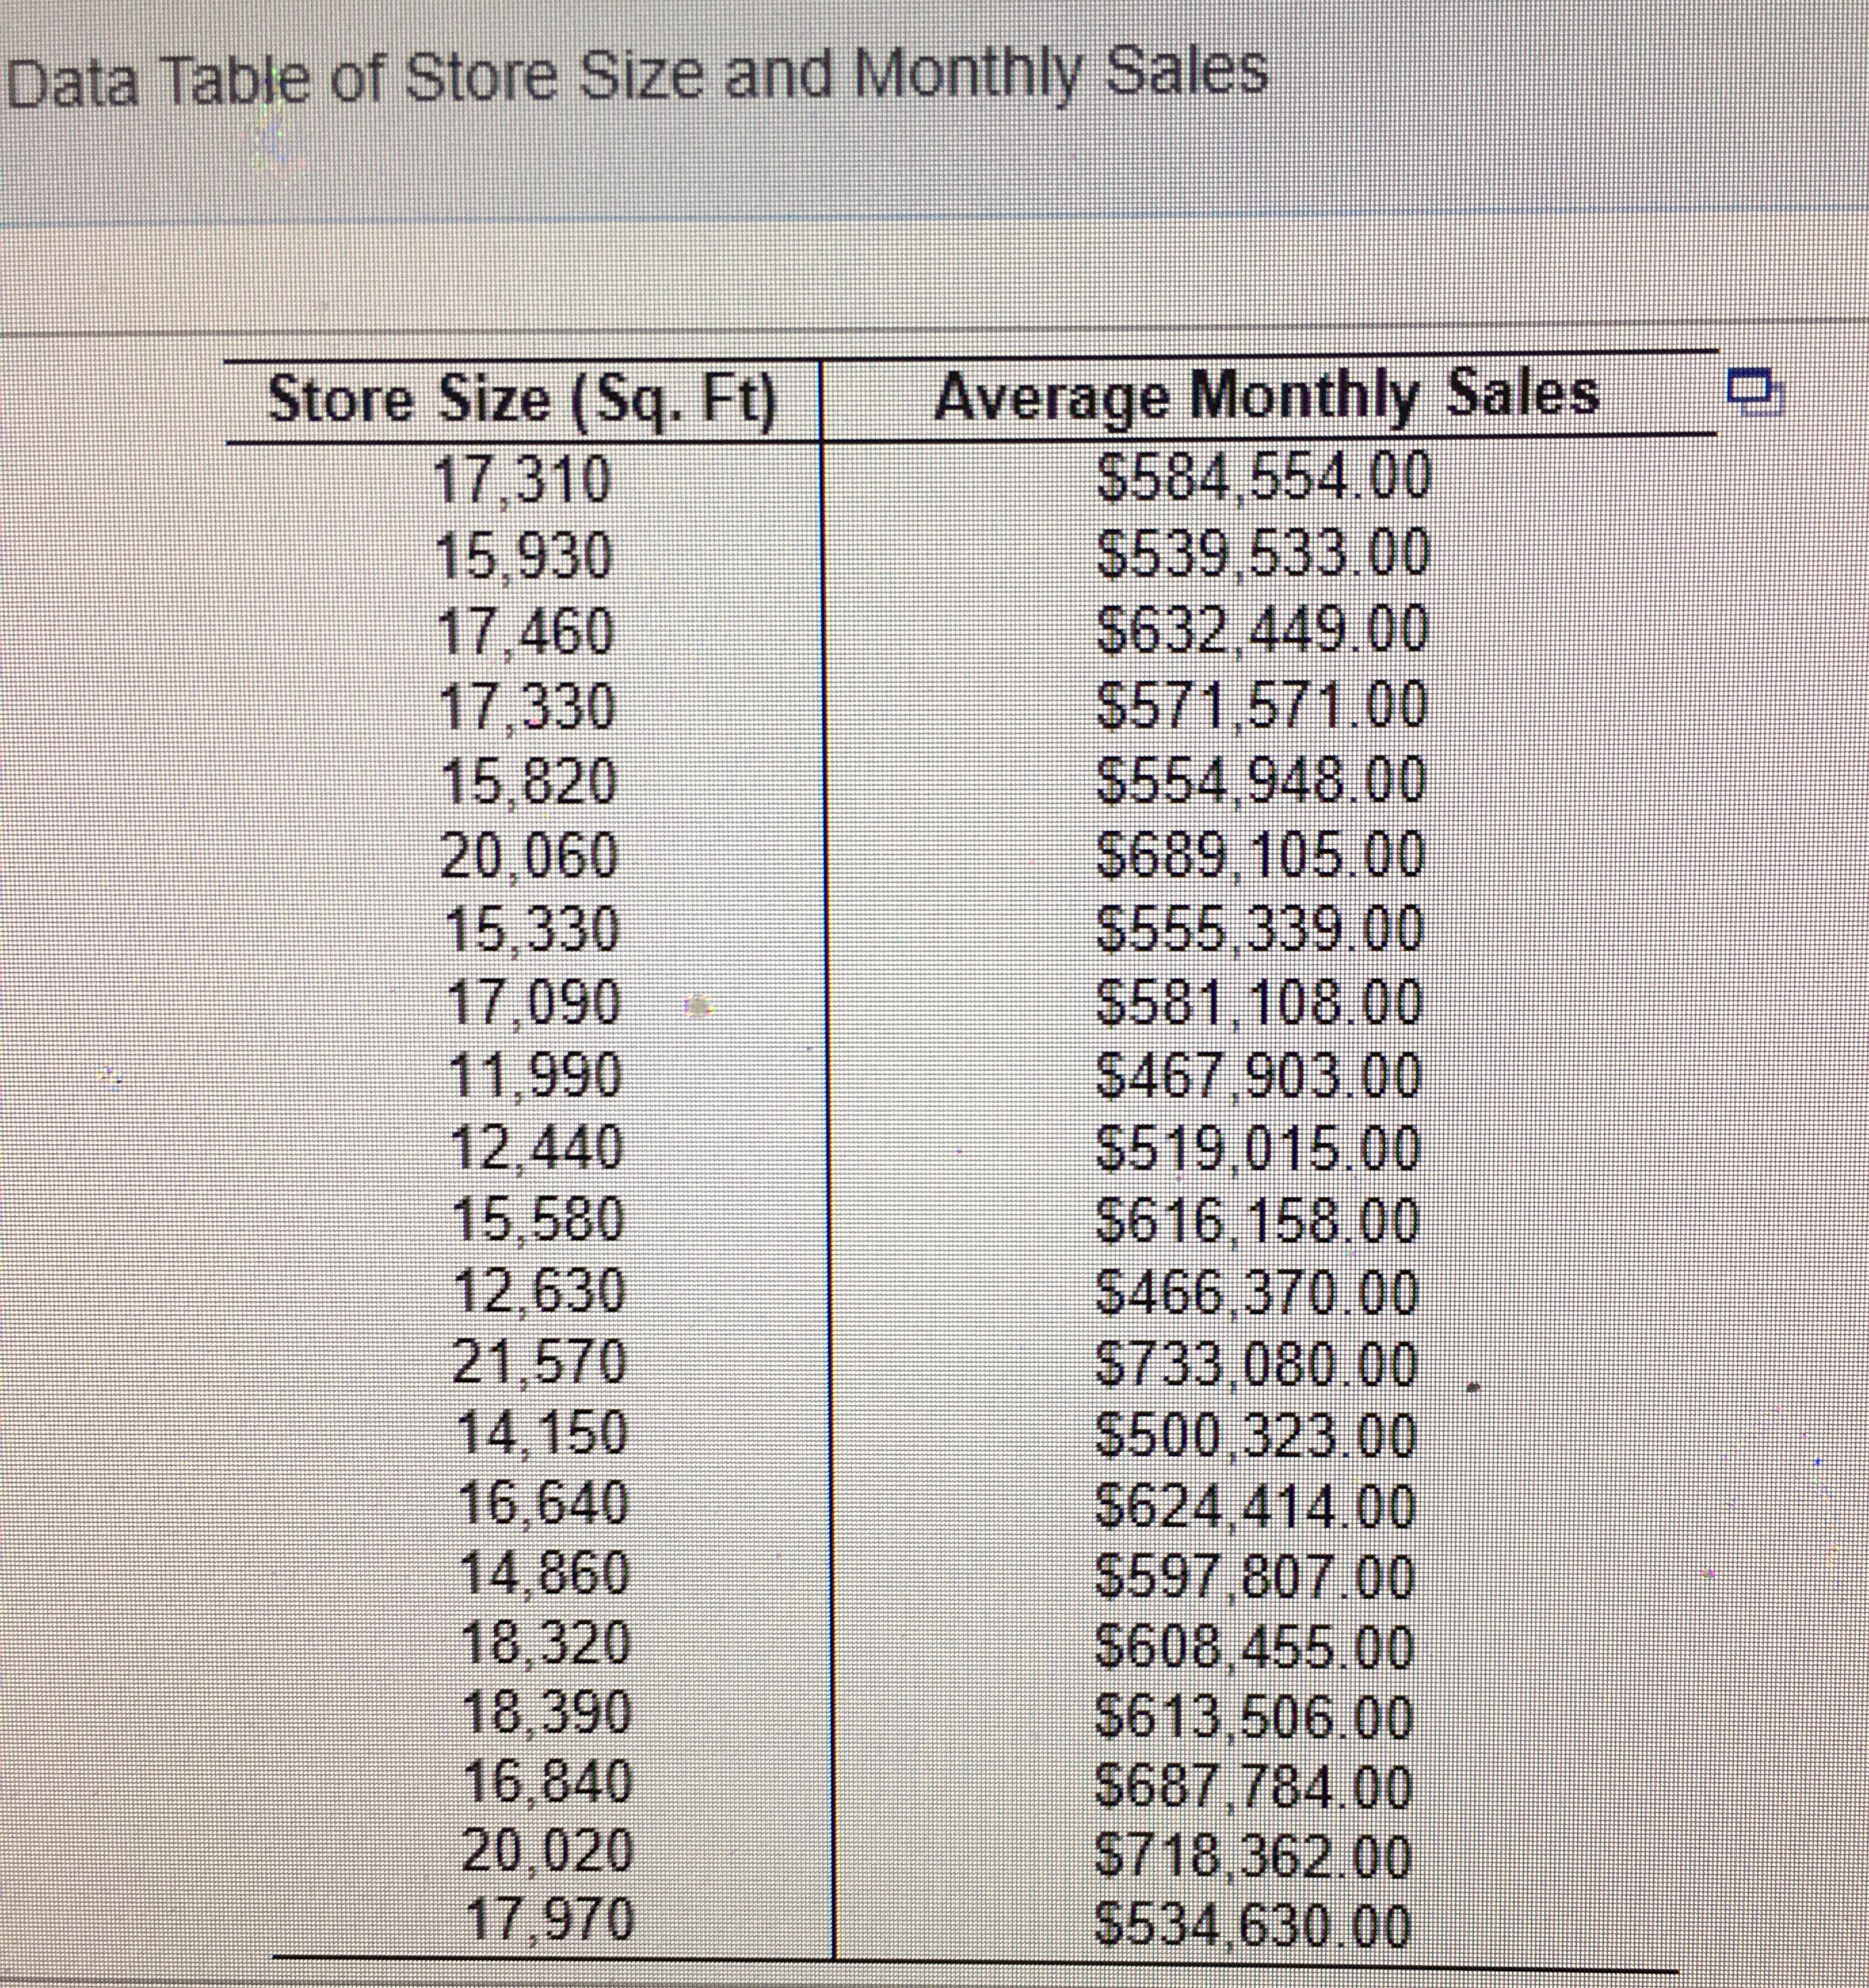
A regional retailer would like to determine if the variation in average monthly store sales can, in part, be explained by the size of the store measured in square feet. A random sample of 21 stores was selected and the store size and average monthly sales were computed. Complete parts a. and b. Click the icon to view the data table between the store size and average monthly sales a. Compute the simple linear regression model using the sample data. Let y be the average monthly store sales and x be the store size in square footage. y = [+()x Round the y-intercept to the nearest whole number and the slope to two decimal places as needed.) Interpret the slope coefficient. Select the correct choice below and fill in the answer box to complete your choice (Type an integer or decimal rounded to two decimal places as needed.) O A. For each additional square foot of store size, the average increase in monthly sales is $ O B. For each additional dollar of monthly sales, the average increase in stores size is square feet. Interpret the intercept coefficient. Select the correct choice below and fill in the answer box to complete your choice. (Type an integer or decimal rounded to two decimal places as needed.) O A. The size of a store with average monthly sales of $0 is square feet. O B. The average monthly sales of a store with 0 square feet is $ O C. A store with no floor space cannot occur, therefore, the y intercept does not have a meaningful interpretation. b. Based on the estimated regression model, what percentage of the total variation in average monthly sales can be explained by store size?Data Table of Store Size and Monthly Sales Store Size (Sq. Ft) Average Monthly Sales 17.310 $584,554.00 15,930 $539,533.00 17.460 $632.449.00 17,330 $571,571.00 15.820 $554.948.00 20,060 $689, 105.00 15,330 $555,339.00 17,090 $581. 108.00 11,990 5467.903.00 12.440 $519,015.00 15,580 $616 158.00 12,630 $466,370.00 21,570 $733,080.00 14, 150 $500,323.00 16.640 $624,414.00 14.860 $597,807.00 18,320 $608,455.00 18,390 $613,506.00 16,840 $687,784.00 20,020 $718,362.00 17,970 $534,630.00
Step by Step Solution
There are 3 Steps involved in it

Get step-by-step solutions from verified subject matter experts