

Question: please answer questions 34 and 35 34. 46 points MendStat15 2.4.623. Two scientists report the survival times for patients with active hepatitis, half treated with
please answer questions 34 and 35
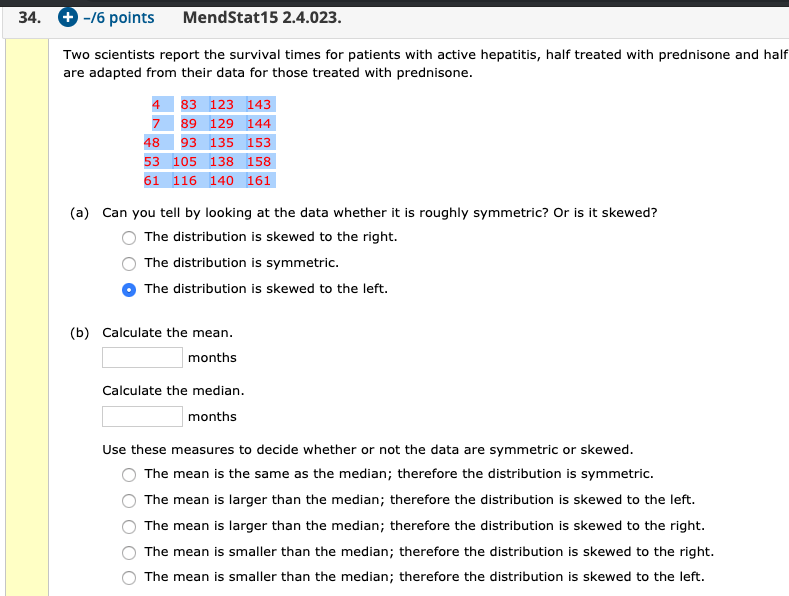
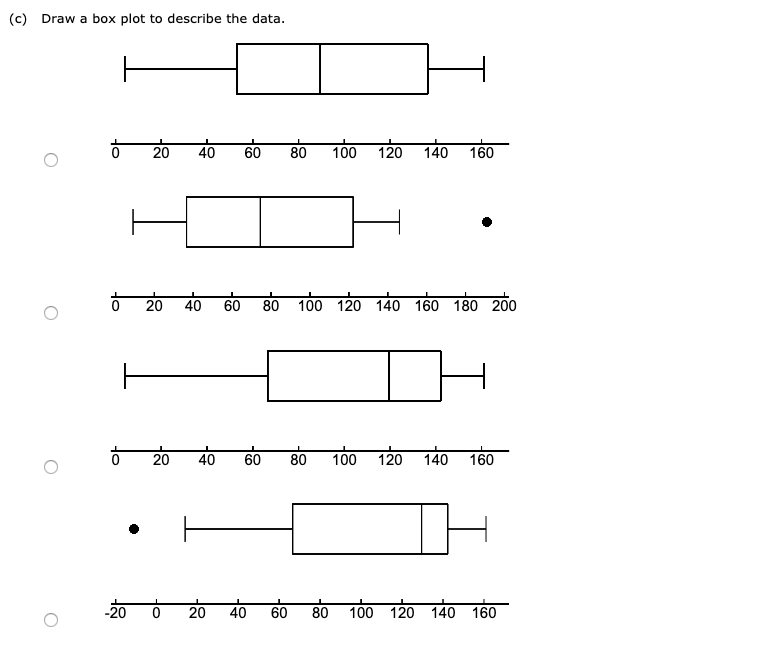
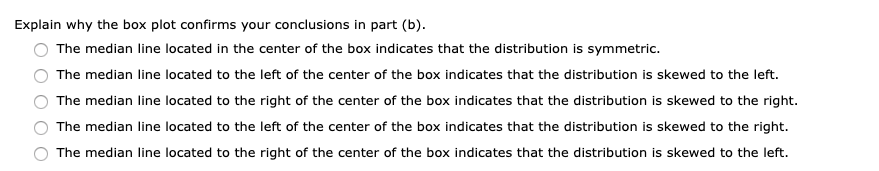
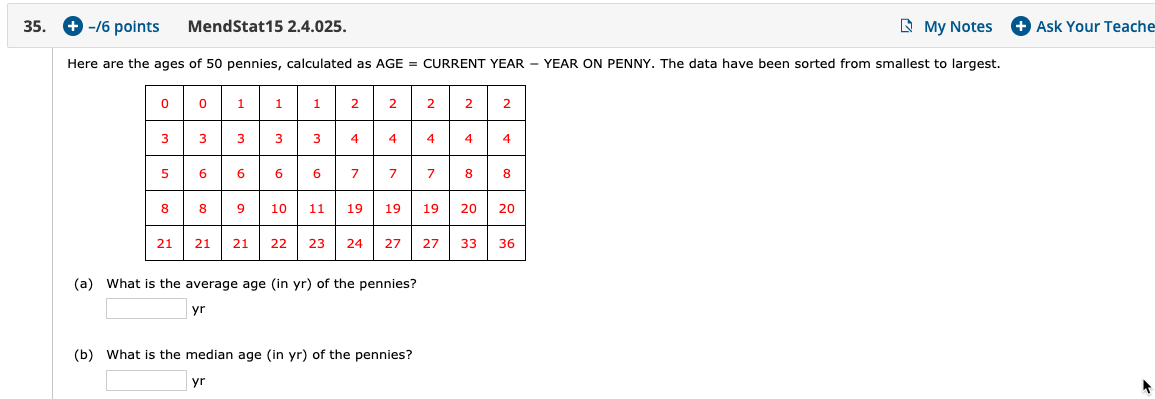
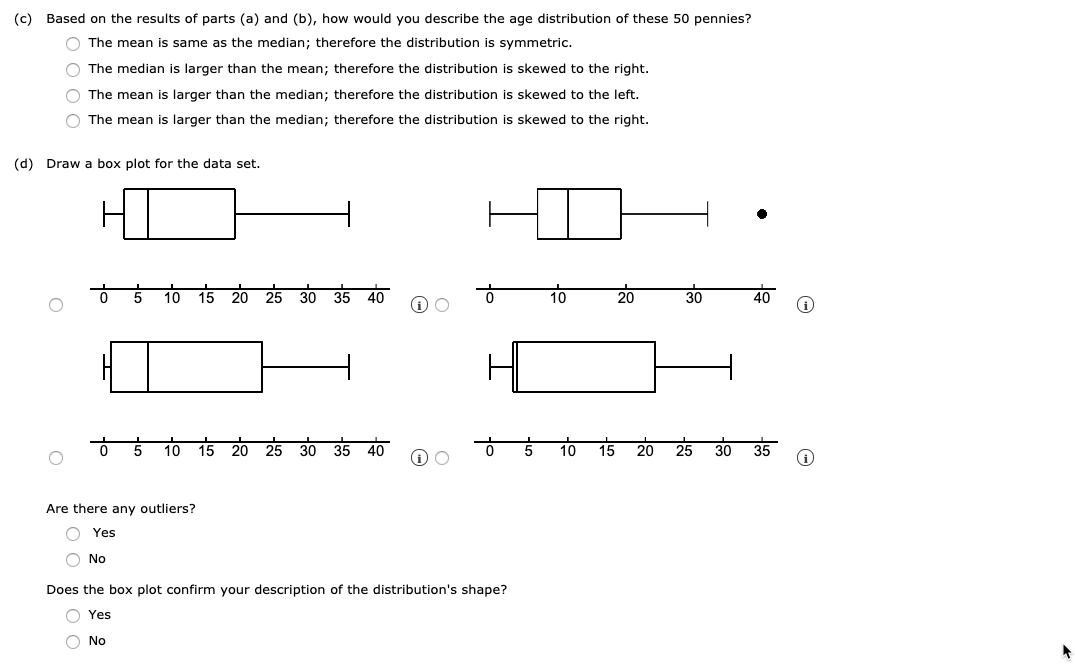
34. 46 points MendStat15 2.4.623. Two scientists report the survival times for patients with active hepatitis, half treated with prednisone and half are adapted from their data for those treated with prednisone. 4 113 I123 I14: 7 89 I129 I144 411 93 I135 I153 53 has I133 I151: 51 I115 Ina I151 {a} Can you tell by looking at the data whether it is roughly symmetric? Or is it skewed? Q The disb'ibution is skewed to the right. Q The disb'ibution is symmetric. a The disb'ibution is skewed to the left. {b} Calculate the mean. months Calculate the median. months Use these measures to decide whether or not the data are symmetric or skewed. Q The mean is the same as the median; therefore the distribution is symmetric. Q The mean is larger than the median; therefore the distribution is skewed to the left. Q The mean is larger than the median; therefore the distribution is skewed to the right. Q The mean is smaller than the median; therefore the distribution is skewed to the right. Q The mean is smaller than the median; therefore the distribution is skewed to the left. \fExplain why the box plot confirms your conclusions In part {b}. m The median line located in the center of the box indicates that the distribution is symmetric. xx N The median line located to the le: of the center of the box Indicates that the distribution is skewed to the left. (""1 The median line located to the right of the center of the box indicates that the distribution is skewed to the right. m The median line located to the left of the center of the box indicates that the distribution is skewed to the right. N The median line located to the right of the center of the box indicates that the distribution is skewed to the le. 35. o 46 points (a) What (b) What MendStat15 2.4.025. 0 O 1 1 1 2 2 2 2 2 3 3 3 3 3 4 4 4 4 4 5 6 6 6 6 2 3" 3" 8 8 8 8 9 10 11 19 19 19 20 2O 21 21 21 22 23 24 2? 2? 33 36 s the average age (In yr) of the penmes? s the median age (in yr) of the pennies? yr yr I} My Notes 0 Ask Your Teache Here are the ages of 50 pennies, calculated as AGE - CURRENT YEAR YEAR ON PENNY. The data have been sorted from smallest to largest. {c} Based on the results of parts (a) and (hi), how would you describe the age distribution of these 50 pennies? C: The mean is same as the median; therefore the distribution is symmetric. C: The median is larger than the mean; therefore the distribution is skewed to the right. C: The mean is larger than the median; therefore the distribution is skewed to the left. Q The mean is larger than the median; therefore the distribution is skewed to the right. (d) Draw a box plot for the data set. . _|_|_|_|_|_|_|_|_|_ _|||||_ F\". 0 5 10 15 20 25 30 35 40 IAI 0 10 20 30 40 _|_|_|_|_|_|_|_|_|_ _IIII|III_ A051015202530354005101520253035 Are there any outliers? f\". Yes \\_z C} No Does the box plot conrm your description of the distribution's shape
Step by Step Solution
There are 3 Steps involved in it

Get step-by-step solutions from verified subject matter experts