

Question: Please answer questions 4 and 5 only. Graph if allowed. Derivation and Plots of Demand Marainal Ravons and Rovons Pnse Name. (10) Duc Please do
Please answer questions 4 and 5 only. Graph if allowed.
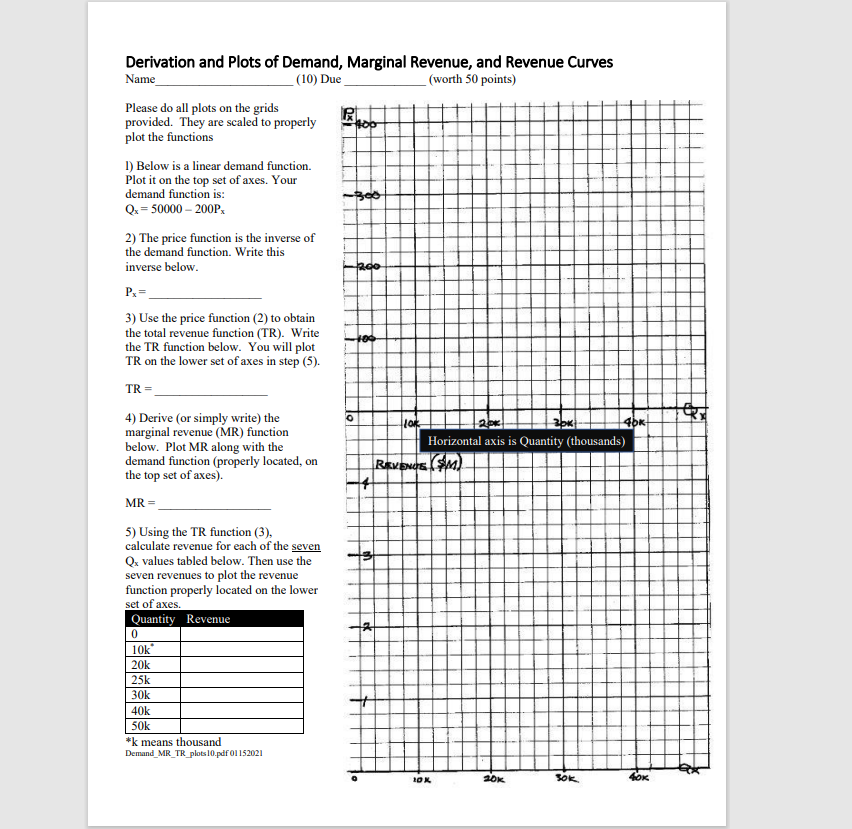
Derivation and Plots of Demand Marainal Ravons and Rovons Pnse Name. (10) Duc Please do all plots on the grids provided. They are scaled to properly plot the functions 1) Below is a linear demand function. Plot it on the top set of axes. Your demand function is: Qx=50000200Px 2) The price function is the inverse of the demand function. Write this inverse below. Px= 3) Use the price function (2) to obtain the total revenue function (TR). Write the TR function below. You will plot TR on the lower set of axes in step (5). TR= 4) Derive (or simply write) the marginal revenue (MR) function below. Plot MR along with the demand function (properly located, on the top set of axes). MR= 5) Using the TR function (3), calculate revenue for each of the seven Qx values tabled below. Then use the seven revenues to plot the revenue function properly located on the lower set of axes. k means thousand Demand_MR_TR_plots 10.pdf 01152021 Derivation and Plots of Demand Marainal Ravons and Rovons Pnse Name. (10) Duc Please do all plots on the grids provided. They are scaled to properly plot the functions 1) Below is a linear demand function. Plot it on the top set of axes. Your demand function is: Qx=50000200Px 2) The price function is the inverse of the demand function. Write this inverse below. Px= 3) Use the price function (2) to obtain the total revenue function (TR). Write the TR function below. You will plot TR on the lower set of axes in step (5). TR= 4) Derive (or simply write) the marginal revenue (MR) function below. Plot MR along with the demand function (properly located, on the top set of axes). MR= 5) Using the TR function (3), calculate revenue for each of the seven Qx values tabled below. Then use the seven revenues to plot the revenue function properly located on the lower set of axes. k means thousand Demand_MR_TR_plots 10.pdf 01152021
Step by Step Solution
There are 3 Steps involved in it

Get step-by-step solutions from verified subject matter experts