Question: Please answer questions 4,5 & 6 in excel along with formulas A transportation planner has set up the following spreadsheet formulation of a transportation problem:
Please answer questions 4,5 & 6 in excel along with formulas 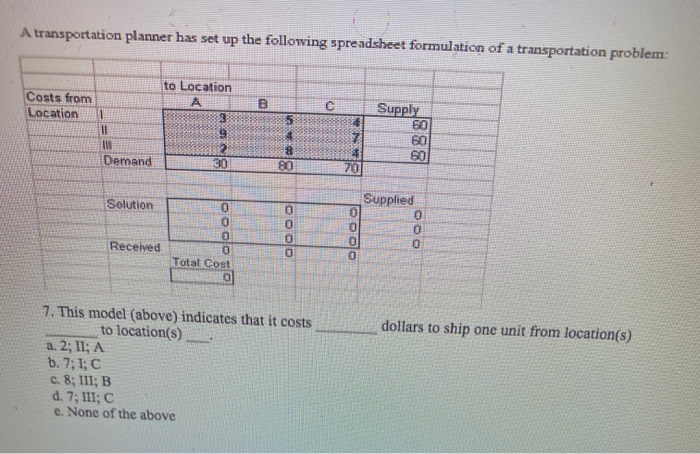
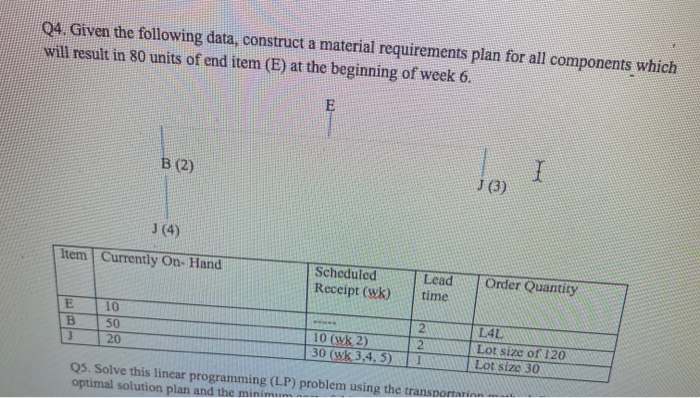
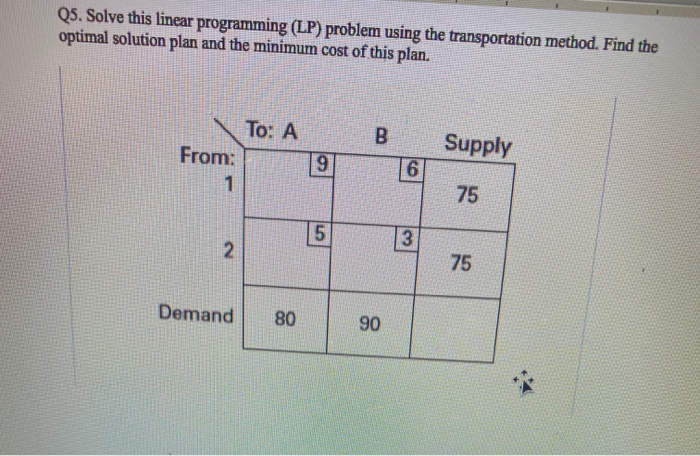
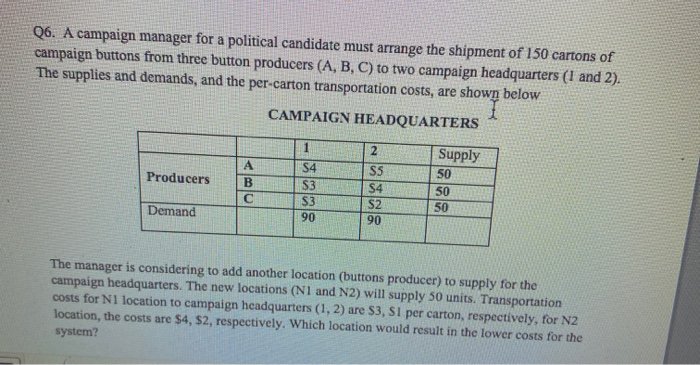
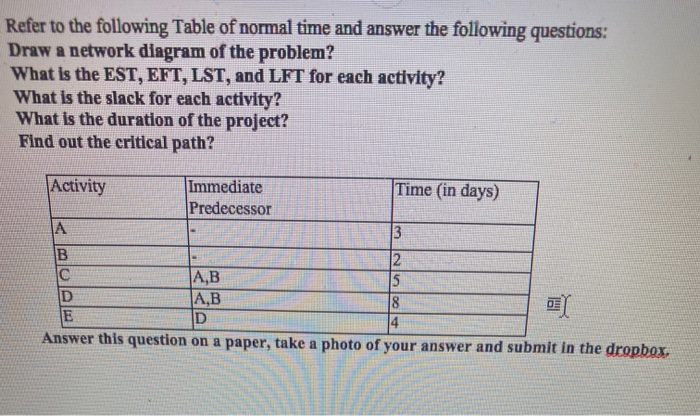
A transportation planner has set up the following spreadsheet formulation of a transportation problem: Costs from Location to Location A 8 - 11 10 Demand Supply 60 60 0 30 80 20 Solution 0 0 0 Supplied 0 0 0 0 Received O Total Cost O 0 0 dollars to ship one unit from location(s) 7. This model (above) indicates that it costs to location(s) a. 2; 11; A b. 7;1;C c. 8; III; B d. 7; 111; e. None of the above Q4. Given the following data, construct a material requirements plan for all components which will result in 80 units of end item (E) at the beginning of week 6. E B (2) I (3) J (4) Item Currently On-Hand Scheduled Receipt (wk) Lead time Order Quantity E B J 10 50 20 10 (wk 2) 30 (wk 3,4,5) 2 2 L4L Lot size of 120 Lot size 30 Q5. Solve this linear programming (LP) problem using the transportation optimal solution plan and the minimum Q5. Solve this linear programming (LP) problem using the transportation method. Find the optimal solution plan and the minimum cost of this plan. To: A B Supply From: 1 19 6 75 5 3 2. 75 Demand 80 90 Q6. A campaign manager for a political candidate must arrange the shipment of 150 cartons of campaign buttons from three button producers (A, B, C) to two campaign headquarters (1 and 2). The supplies and demands, and the per-carton transportation costs, are shown below CAMPAIGN HEADQUARTERS 2 Producers B S4 S3 S3 90 SS S4 S2 90 Supply 50 50 50 Demand The manager is considering to add another location (buttons producer) to supply for the campaign headquarters. The new locations (N1 and N2) will supply 50 units. Transportation costs for Ni location to campaign headquarters (1, 2) are $3, S1 per carton, respectively, for N2 location, the costs are $4, $2, respectively. Which location would result in the lower costs for the system? Refer to the following Table of normal time and answer the following questions: Draw a network diagram of the problem? What is the EST, EFT, LST, and LFT for each activity? What is the slack for each activity? What is the duration of the project? Find out the critical path? Activity Immediate Time (in days) Predecessor 3 B 2 C A,B 5 D |AB 8 E D 4 Answer this question on a paper, take a photo of your answer and submit in the dropbox


